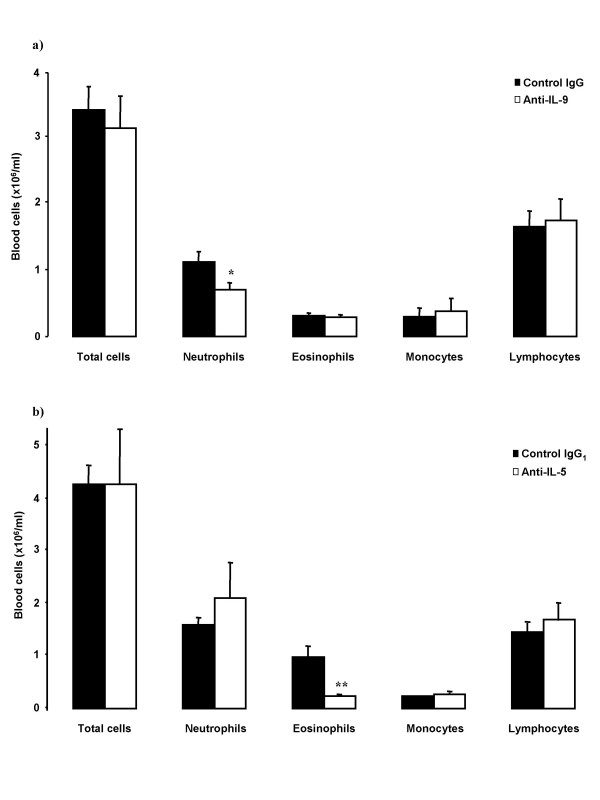
Figure 5.
Blood cellular profiles in OVA-sensitized and on five days exposed to OVA Balb/c mice. Animals were pretreated with a) anti-IL-9 antibody or its isotype control IgG (100 μg/animal); or with b) anti-IL-5 antibody or its isotype control IgG1 (50 μg/animal) 30 minutes before the first exposure. Blood was taken 24 hours after the last OVA-exposure. Data are shown as mean ± SEM (n = 5–10 per group). *p < 0.05, **p < 0.01 compared with the corresponding isotype control antibody (Mann-Whitney U test).

