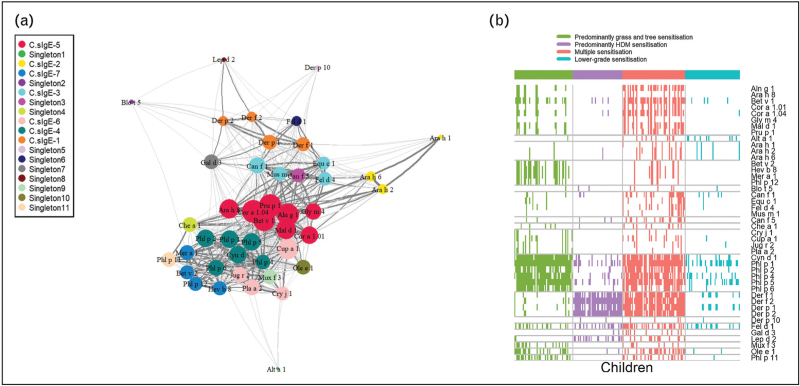
FIGURE 1.
Specific IgE network and sensitization patterns in an unselected birth cohort. (a) Component-specific IgE network and hierarchical cluster reveal connectivity structure in sIgE. The network consists of a set of nodes, joined in pairs by lines or edges. Colours represent cluster memberships. (b) Patterns of IgE responses to allergen components for individual participants. Rows represent sIgEs, while columns indicate children. Colours represent sensitization clusters’ membership. Squares are coloured if and only if a child has a positive response, <0.30 to a particular sIgE. Adapted from [69].

