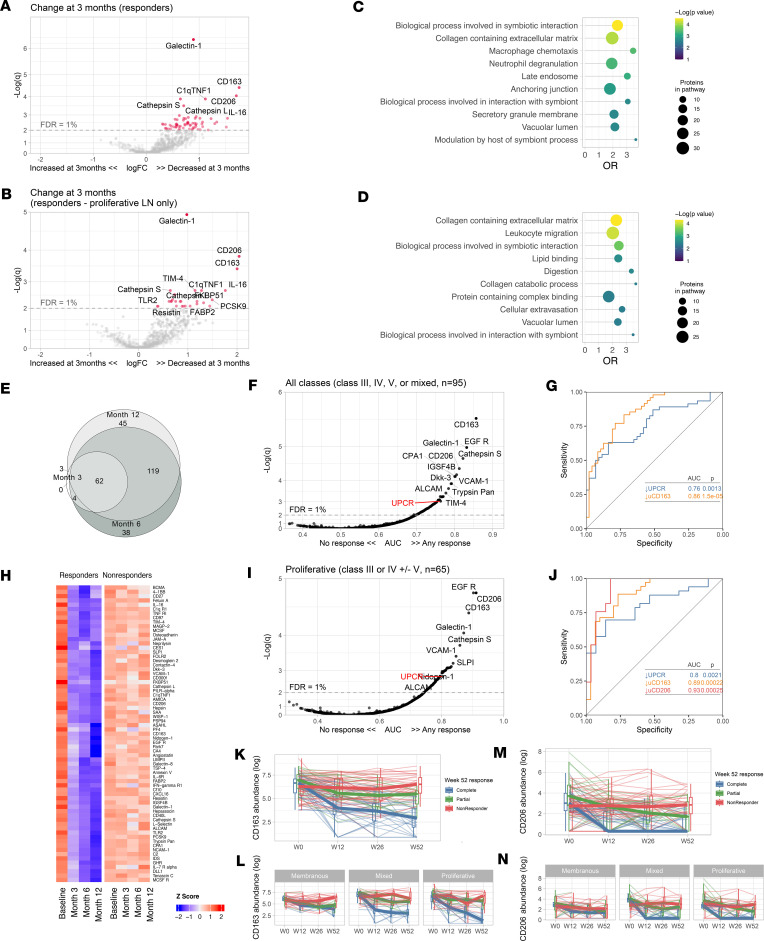
Figure 4. Proteomic changes of treatment response.
Volcano plots of the changes of the urinary proteomic profiles of treatment responders at 3 months after kidney biopsy/treatment compared with baseline at time of biopsy in proliferative and membranous combined (A) or proliferative only (B). (C and D) Pathway enrichment analysis of the urinary proteins declined in A and B, respectively. (E) Venn diagram summarizing the shared significantly changed proteins at 3, 6, and 12 months after the kidney biopsy. (F) Heatmap displaying the urinary abundances of the proteins significantly decreased at 3 months in responders from panel A at the 4 time points according to response status. (G) Discriminatory power of the change of each urinary protein at 3 months compared with baseline to predict treatment response at month 12 (n = 95) (displayed as area under the curve, AUC). The change in UPCR is displayed for reference as the traditionally used biomarker. (H) Receiver operating characteristic curves of the decline at 3 months of the UPCR (traditional biomarker) and urinary CD163. I and J replicate G and H, but limited to patients with proliferative LN (n = 65). (K–N) Trajectory of the urinary abundance of CD163 (K and L) and CD206 (M and N) according to response status in all patients and stratified by ISN class. Thin lines indicate individual trajectories; thick lines indicate the group medians; box plots indicate medians, interquartile range, and range. q, adjusted P values (Benjamini-Hochberg); OR, odds ratio; FDR, false discovery rate.

