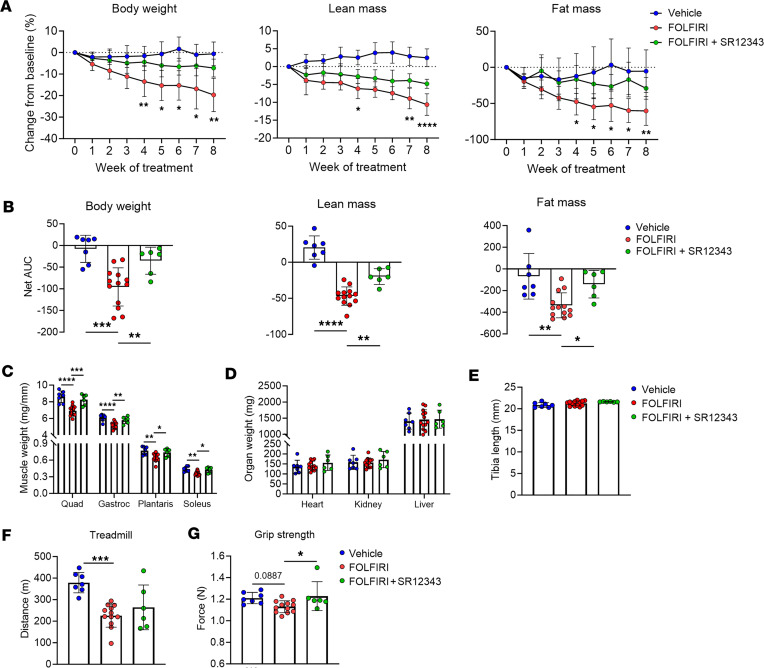
Figure 6. SR12343 is protective against the hallmarks of cachexia.
(A) Longitudinal measurements of body weight, lean mass, and fat mass. (B) Net area under the curve (AUC) quantified for body weight, lean mass, and fat mass. (C) Quadriceps (Quad), gastrocnemius (Gastroc), plantaris, and soleus weights. (D) Organ weights. (E) Tibia length. (F) Distance run-to-exhaustion on a treadmill test. (G) Grip strength test. Data represent mean ± SD. *P < 0.05; **P < 0.01; ***P < 0.001; ****P < 0.0001, as assessed by repeated measures 2-way ANOVA with Tukey’s correction (A) or 1-way ANOVA with Šidák’s correction (B–G).

