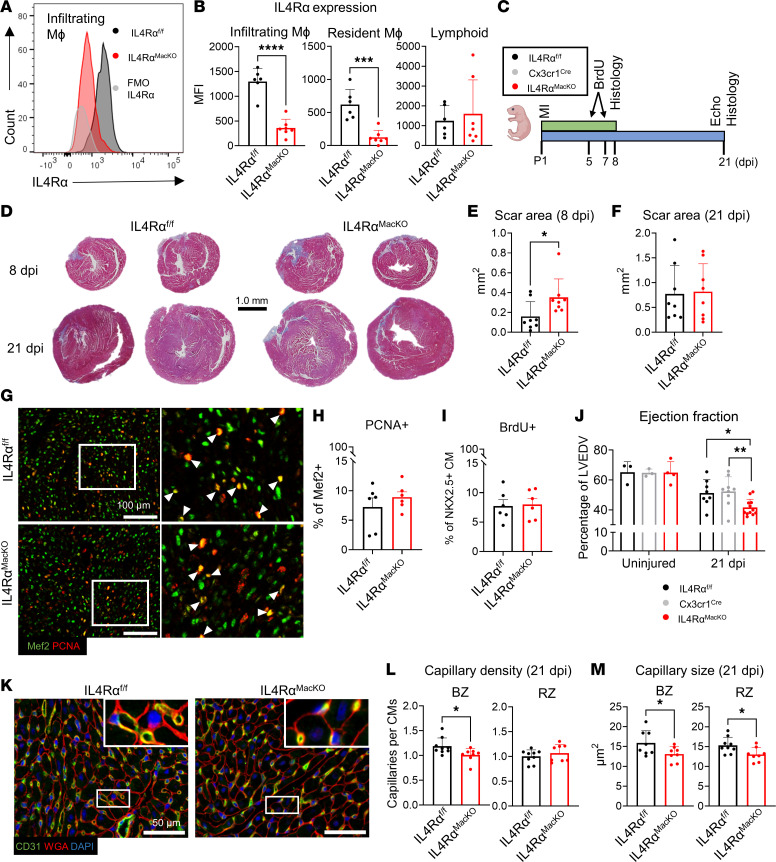
Figure 1. Macrophage (Mφ) IL-4Rα deletion impairs neonatal cardiac repair.
(A) Representative histogram plots of IL-4Rα expression in cardiac Mφ isolated from IL-4Rαfl/fl and IL-4RαMacKO mice at 4 dpi after P1 MI. FMO–IL-4Rα control is also shown. (B) Quantification of IL-4Rα MFI in infiltrating Mφ, resident Mφ, and lymphoid cells. (C) Experimental scheme of P1 MI, BrdU injections on 5 and 7 dpi, heart collections for histology at 8 dpi, cardiac echocardiogram (Echo), and heart collection for histology at 21 dpi. (D) Representative images showing Gömöri trichrome staining of mouse hearts at 8 and 21 dpi. Scale bar: 1 mm. (E and F) Quantification of total scar area in mm2 of mice at 8 dpi and 21 dpi. (G) Representative images of Mef2/PCNA immunostaining of cardiac sections at 8 dpi after P1 MI. Arrowheads indicate PCNA+/Mef2+ cells. White box inset indicates zoomed-in region. (H) Quantification of PCNA+/Mef2+ cells as a percentage of total Mef2+ nuclei quantified. (I) Quantification of BrdU+/NKX2.5+ cells (staining not shown) as a percentage of total Nkx2.5+ nuclei quantified. (J) Quantification of LV ejection fraction of mice at 21 dpi after P1 MI or age-matched uninjured conditions. (K) Representative images of CD31, WGA, and DAPI staining of mouse hearts at 21 dpi after P1 MI. (L and M) Quantification of capillary density and capillary size at the BZ and RZ of mouse hearts at 21 dpi. Data are presented as mean ± SD. Each data point represents 1 mouse. *P < 0.05, **P < 0.01, ***P < 0.001, ****P < 0.0001. Comparison by unpaired 2-tailed t test in B, E, F, H, I, L, and M. Interaction of condition (uninjured versus 21 dpi) and genotype effect by 2-way ANOVA and Sidak’s post hoc test for IL-4RαMacKO versus other 2 genotypes in J.

