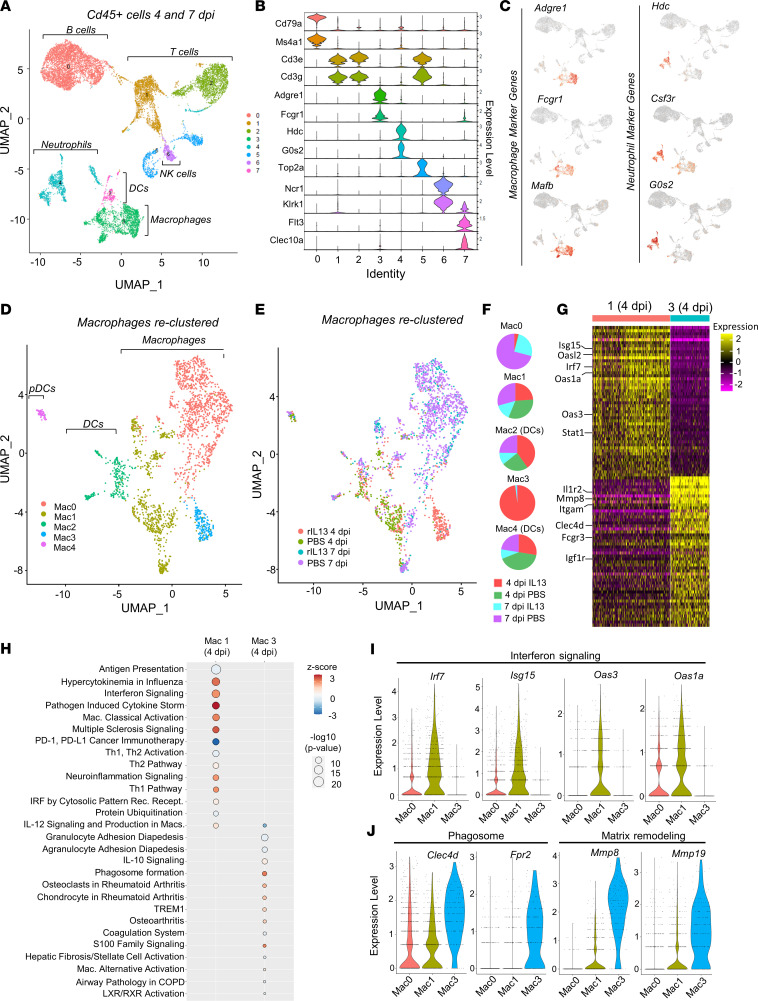
Figure 6. rIL-13 induces a unique macrophage cluster at 4 dpi.
(A) Uniform Manifold Approximation and Projection (UMAP) plot of live leukocytes isolated from mouse hearts at 4 and 7 dpi after PBS or rIL-13 daily administration. Four samples were given: PBS at 4 dpi, PBS at 7 dpi, rIL-13 at 4 dpi, rIL-13 at 7 dpi. n = 2 or 3 mice per sample. (B) Violin plots showing expression of unique markers that defined the identity of each of the 7 clusters identified in A. (C) Feature plots showing expression of macrophage specific markers in clusters 3 and 7 and unique neutrophils markers in cluster 4. (D) Clusters 3 and 7 from A were reclustered, resulting in 5 unique clusters (clusters 0–4), among which 0, 1, and 3 correspond to macrophages and 2 and 4 are DCs. (E and F) UMAP plots and pie charts showing the contribution of each sample to each macrophage cluster. Mac3 is 98% derived from rIL-13 4 dpi. (G) Heatmap showing top 50 DEG in Mac1 and Mac3 at 4 dpi only. Top colors represent cluster ID. Color scale bar represents directionality of expression (log FC threshold 0.7. Adjusted P < 0.1 × 10⁻¹⁷). (H) Ingenuity pathway analysis identified top upregulated canonical pathways in macrophage clusters 1 and 3. Color scale bar represents directionality of expression. Circle size represents statistical significance. (I) Violin plots showing expression of IFN response elements in macrophage clusters 0, 1, and 3. (J) Violin plots showing expression of phagocytic associated markers and extracellular matrix remodeling factors in macrophage clusters 0, 1, and 3.

