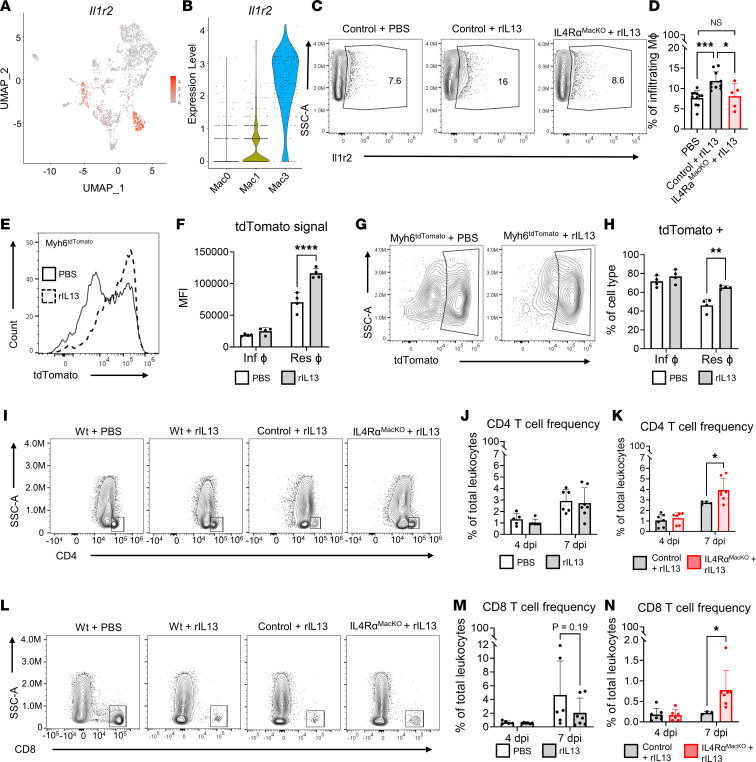
Figure 7. IL-13/IL-4Rα reactivation in macrophages induces IL-1R2 expression in vivo.
(A and B) Feature plot of IL-1r2 expression in macrophages and violin plots of IL-1r2 expression in Mac0, Mac1, and Mac3 clusters. (C) Representative contour plots showing IL-1r2 expression in infiltrating cardiac macrophages at 4 dpi after MI. (D) Quantification of IL-1r2+ cardiac macrophage frequency at 4 dpi after MI. (E) Representative histograms showing tdTomato signal in cardiac resident macrophages from Myh6tdTomato mice treated with PBS versus rIL-13 after MI. (F) Quantification of tdTomato mean fluorescence intensity (MFI) in cardiac macrophages from Myh6tdTomato mice treated with PBS versus rIL-13 after MI. (G and H) Representative contour plots and quantification of tdTomato+ cardiac resident macrophages in Myh6tdTomato mice treated with PBS versus rIL-13 after MI. (I) Representative contour plots showing cardiac CD4 T cell populations in WT mice treated with PBS versus rIL-13 and control and IL-4RαMacKO mice treated with rIL-13 after MI. (J and K) Quantification of cardiac CD4 T cells frequencies after MI in WT mice, and control and IL-4RαMacKO mice treated with rIL-13 after MI. (L) Representative contour plots showing cardiac CD8 T cell populations in WT mice treated with PBS versus rIL-13 and control and IL-4RαMacKO mice treated with rIL-13 after MI. (M and N) Quantification of cardiac CD8 T cell frequencies in WT mice, and control and IL-4RαMacKO mice treated with rIL-13 after MI. Data are shown as mean ± SD. Each data point represents 1 mouse. *P < 0.05, **P < 0.01, ***P < 0.001, ****P < 0.0001. Comparison by 1-way ANOVA and Tukey’s post hoc test in D. Treatment effect by 2-way repeated-measures ANOVA and Sidak’s post hoc comparison in F and H. Time effect by 2-way ANOVA and Sidak’s post hoc comparison in J and M. Interaction effect of time and genotype by 2-way ANOVA and Sidak’s post hoc comparison in K and N.

