Figure 3.
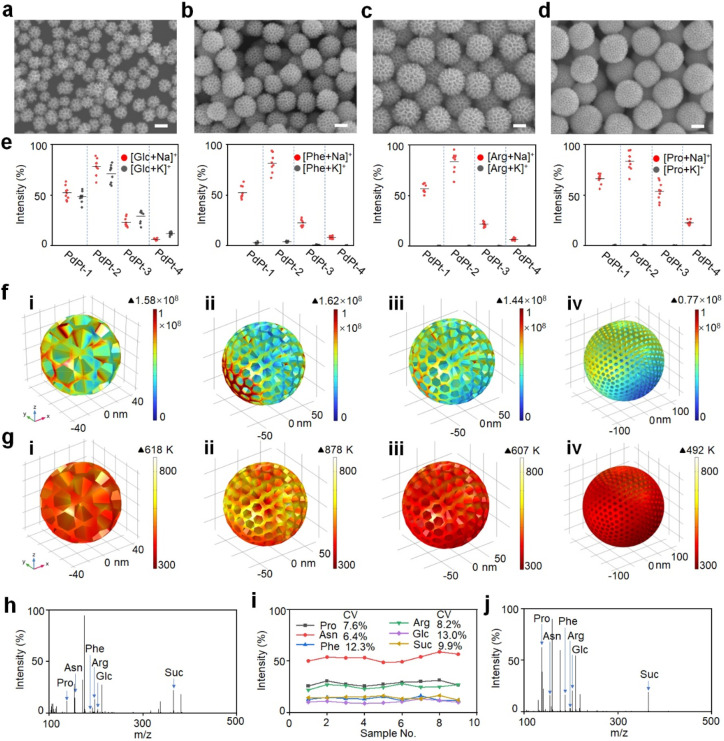
Optimization of PdPt alloys for metabolite detection. SEM images of (a) PdPt-1, (b) PdPt-2, (c) PdPt-3, and (d) PdPt-4 alloys with different particle sizes. (e) Intensities of sodium- and potassium-adducted signals of glucose (Glc), phenylalanine (Phe), arginine (Arg), and proline (Pro) detected by PdPt-1/2/3/4 alloy-assisted LDI MS. The error bars were determined as the standard deviation (s.d.) of nine measurements. Contour plots of (f) electric field amplitudes and (g) thermal field distribution shown on the color scale for (i) PdPt-1, (ii) PdPt-2, (iii) PdPt-3, and (iv) PdPt-4 alloys, for a 355 nm laser beam with polarization along the Y axis. Laser light was introduced along the Z-axis. The electric field amplitudes and thermal field distribution were counted by the finite element method. (h) Typical mass spectrometry of different metabolites (Pro, asparagine (Asn), Phe, Arg, Glc and sucrose (Suc)) in water solution, detected by PdPt-2 alloys assisted LDI MS. (i) Coefficient of variance (CV) distribution of different metabolites (Pro, Asn, Phe, Arg, Glc and Suc) analyzed by PdPt-2 alloys assisted LDI MS. The results come from nine independent experiments. (j) Typical mass spectrometry of different metabolites (Pro, Asn, Phe, Arg, Glc, and Suc) in a mixture solution of 0.5 M NaCl (salt tolerance detection) and 5 mg mL–1 bovine serum albumin (protein endurance detection), detected by PdPt-2 alloy-assisted LDI MS. Scale bar: (a, b, c, d) 100 nm.

