Figure 4.
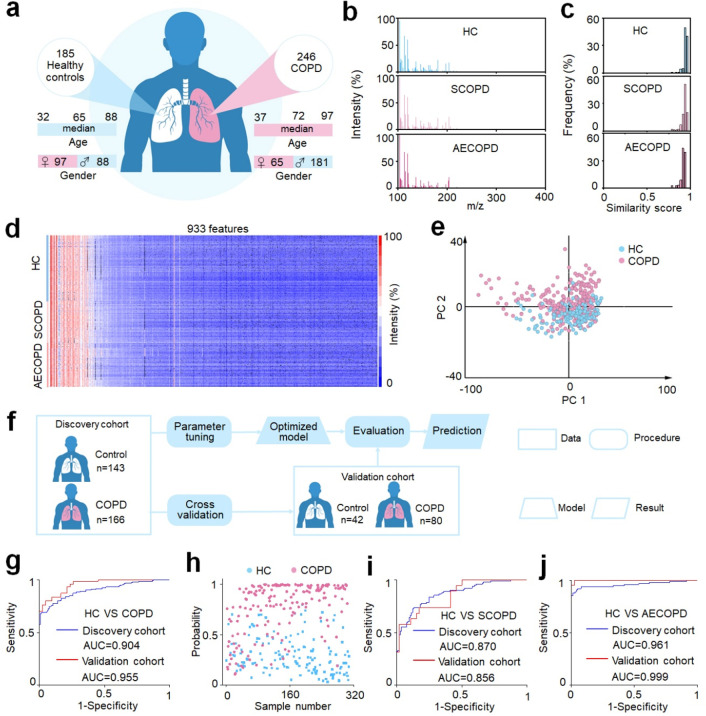
Machine learning of metabolic fingerprints for COPD diagnosis. (a) Demographic characteristics of 431 clinical specimens, including age and gender information on 185 healthy controls (HC) and 246 COPD patients (122 stable COPD (SCOPD) patients and 124 acute exacerbations of COPD (AECOPD) patients). (b) Typical mass spectra of plasma extracts from HC, SCOPD, and AECOPD samples with m/z ranging from 100 to 400, using 0.5 μL of native plasma. (c) The frequency distribution of similarity scores was computed for HC, SCOPD, and AECOPD groups. (d) Metabolic fingerprints were extracted from raw mass spectra of 185 healthy controls and 246 COPD patients, each containing 933 m/z features. (e) The unsupervised principal component analysis (PCA) showed a certain degree of discrimination between 185 healthy controls and 246 COPD patients. (f) Workflow for the diagnosis of COPD by machine learning. The discovery cohort comprised 309 samples (143/166, HC/COPD) used for parameter tuning and model construction. The optimized model was evaluated using an independent validation cohort with 122 subjects (42/80, HC/COPD). No statistically significant differences in age and gender between HC and COPD in the discovery cohort (p > 0.05). (g) The receiver operator characteristic (ROC) curve differentiates HC from COPD for the discovery (blue) and validation (red) cohorts. (h) Scatter diagram for HC and COPD from the discovery cohort. A probability of close to 1 implied a high level of certainty in the model that the sample belonged to class 1 (patient). In contrast, a probability close to 0 indicated a model inclination toward classifying the sample as class 0 (healthy control).22,92 ROC curves differentiate (i) HC from SCOPD and (j) HC from AECOPD for the discovery (blue) and validation (red) cohorts.

