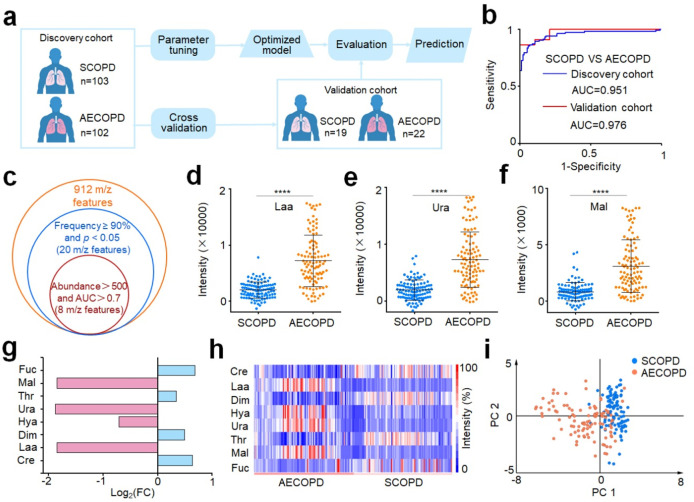
Figure 5.
Machine learning of metabolic fingerprints for AECOPD diagnosis and biomarker discovery. (a) Workflow for the diagnosis of AECOPD by machine learning. The discovery cohort included 205 samples (103/102, SCOPD/AECOPD) for parameter tuning and model construction. The optimized model was tested in an independent validation cohort with 41 individuals (19/22, COPD/AECOPD). No statistically significant differences in age and gender between SCOPD and AECOPD in the discovery cohort (p > 0.05). (b) ROC curves differentiate SCOPD from AECOPD for the discovery (blue) and validation (red) cohorts. (c) Venn diagram of 8 m/z features screened as the metabolic signature panel with frequency ≥90%, p < 0.05, abundance >500, and AUC of single feature >0.7. Scatter diagram of three key differential features for SCOPD and AECOPD, including (d) lactic acid (Laa), (e) uric acid (Ura), and (f) malondialdehyde (Mal). **** is represented by p < 0.0001. (g) Fold change of four up-regulated metabolites (Laa, Ura, Mal, and 3-hydroxybutyric acid (Hya) with magenta color) and four down-regulated metabolites (creatine (Cre), dimethylglycine (Dim), threonine (Thr), and fucose (Fuc) with cyan color) in AECOPD patients compared with SCOPD. (h) The heat map of the discovery cohort, including SCOPD and AECOPD patients, is constructed by eight metabolic biomarkers as potential signatures for AECOPD diagnosis. (i) PCA analysis showed a clear discrimination between SCOPD and AECOD patients based on eight metabolic biomarkers.

