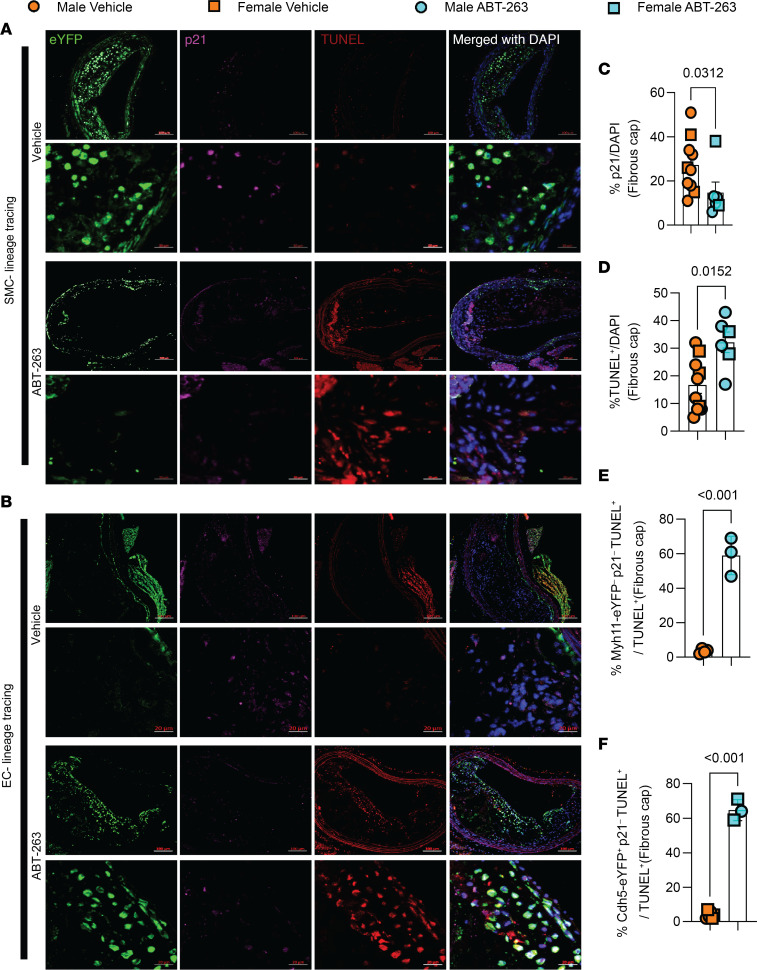
Figure 5. ABT-263 treatment (100mg/kg/bw) of SMC (Myh11-CreERT2-eYFP) and EC (Cdh5-CreERT2-eYFP) lineage tracing Apoe–/– mice with advanced atherosclerotic lesions was associated with a marked increase in nonsenescent endothelial cell apoptosis.
(A) Representative confocal images of costaining for eYFP (for detecting SMC), p21 (detecting senescent cells), TUNEL (detecting apoptotic cells), and DAPI in advanced BCA lesions from SMC lineage tracing Apoe–/–mice were fed a WD for 18 weeks, followed by 100 mg/kg/bw ABT-263 treatment on WD for 6 weeks. The confocal images show a maximum intensity projection ×20 zoom. Scale bar: 100 μm and 20 μm (zoomed-in images). (B) Representative confocal images of costaining for eYFP (for detecting EC), α-SMA+, and DAPI in advanced BCA lesions from EC lineage tracing Apoe–/– mice were fed a WD for 18 weeks followed by 100 mg/kg/bw ABT-263 treatment on WD for 6 weeks. Scale bars: 100 μm (top); 20 μm (bottom). (C) Quantification of the percentage of p21+ (p21+/DAPI+) cells in the fibrous cap from A and B. (D) Quantification of the percentage of TUNEL+ (TUNEL+/DAPI+) cells in the fibrous cap from A and B. (E) Non–SMC-derived nonsenescent apoptotic cells (Myh11-eYFP– p21– TUNEL+/TUNEL+) of all apoptotic cells from A. (F) EC-derived nonsenescent apoptotic cells (Cdh5-eYFP+ p21– TUNEL+/TUNEL+) of all apoptotic cells from B. Mann-Whitney U tests were used for statistical analysis in C–F. Biologically independent animals are indicated as individual dots. Data are shown as mean ± SEM (C and D) and ± SD (E and F). The P values are indicated on the respective graphs.

