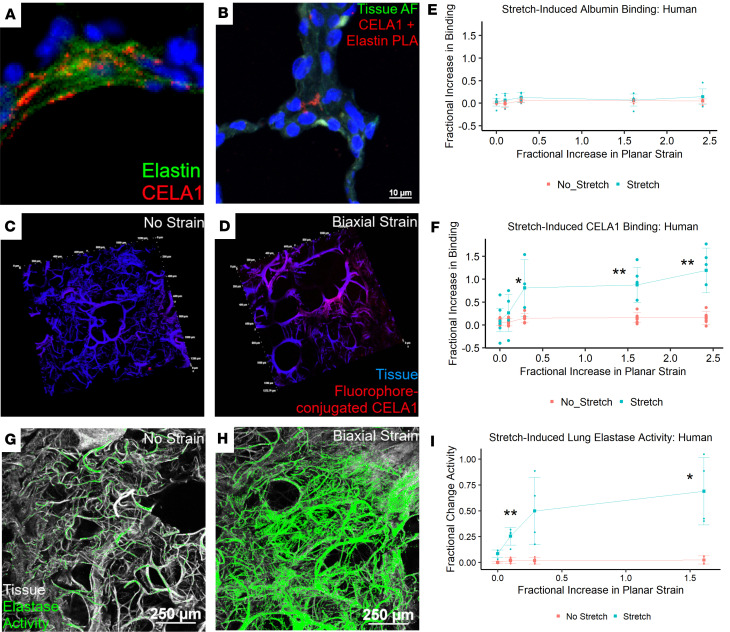
Figure 5. CELA1 in human lung and stretch-dependent binding and elastase activity.
(A) Immunofluorescence imaging for human tropoelastin (green) and CELA1 (red) demonstrated CELA1 protein found near elastin fibers in the airspace walls. Scale bar: 100 μm. (B) Proximity ligation assay (PLA) was performed in human lung using anti-tropoelastin and anti-CELA1 antibodies. Red signal is obtained when antibodies are located within 40 nm of each other. This red signal was observed in the alveolar interstitium. (C) Using fluorophore-conjugated CELA1, human lung tissue sections demonstrated little binding of CELA1 (red) to lung tissue (blue) in the absence of strain. Tissue section is 100 μm thick and each tick mark represents 200 μm. Dashed line highlights a comparison region. (D) When subjected to biaxial strain, CELA1 binding to lung tissue increased. The dashed line highlights the same region as the prior panel. (E) Fluorophore-conjugated albumin binding to lung tissue did not increase with strain. This channel was omitted from images for clarity. (F) Quantification of CELA1 binding in 4 independent lung specimens shows that binding increases with increasing levels of strain to approximately 5-fold. *P < 0.05, **P < 0.01 by 2-tailed Welch’s t test. (G) Using a fluorophore-conjugated and quenched soluble elastin substrate for in situ zymography, human lung tissue (white) does not have appreciable elastase activity (green) at baseline. Scale bars: 250 μm. (H) When subjected to biaxial strain, there is an increase in lung elastase activity. (I) Lung elastase activity increases with strain by approximately 8-fold. *P < 0.05, **P < 0.01 by 2-tailed Welch’s t test.

