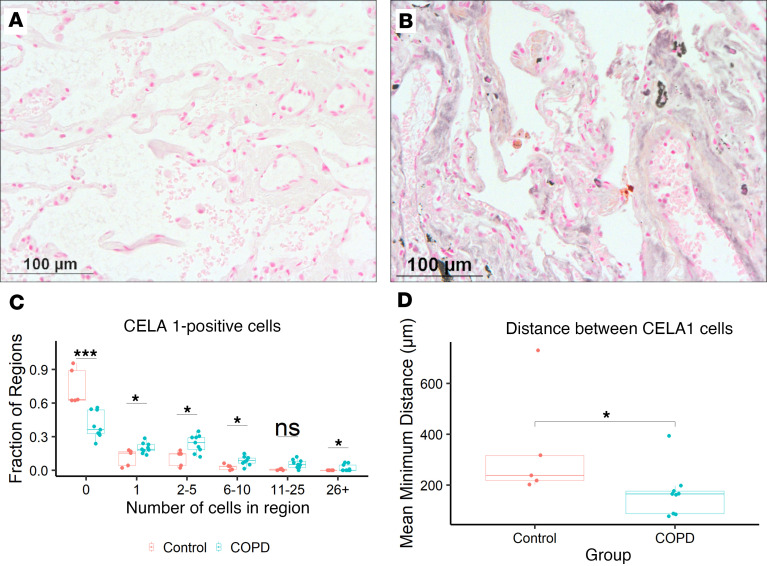
Figure 7. Distribution of CELA1-expressing cells in COPD.
(A) In control lung, CELA1-expressing cells were rare. Representative ×20 photomicrograph shown. (B) In COPD lung sections, CELA1-expressing cells were more numerous. Scale bars: 100 μm. (C) Five control and 9 COPD specimens were stained for CELA1 and tile scanned to assess the distribution of CELA1-expressing cells in COPD. Images were overlaid with 1 mm × 1 mm regions of interest and the number of cells in each region counted. COPD specimens had a greater number of grids with CELA1-positive cells. *P < 0.05, ***P < 0.001 by Mann-Whitney U test. (D) The average minimum distance between each CELA1-positive cell and its nearest neighbor was determined for each section. CELA1-positive cells were closer together in COPD specimens. Mann-Whitney U test P value shown on the plot.

