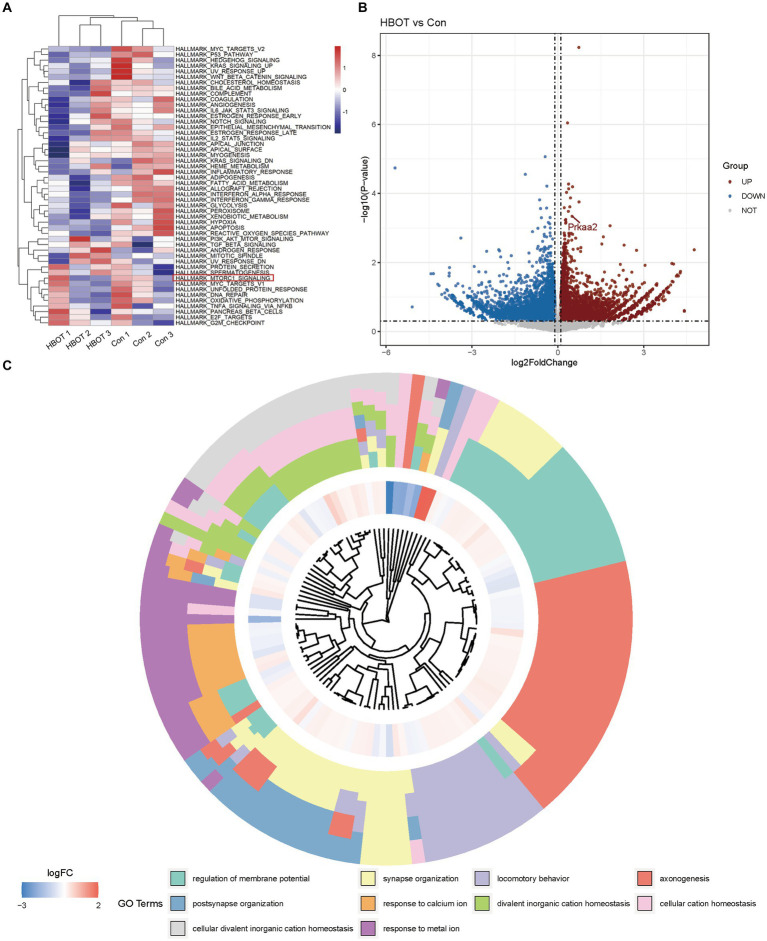
Figure 3.
Bioinformatics analysis of eukaryotic referent transcriptome in aged C57BL/6 mice. (A) Gene Set Variation Analysis (GSVA) results of HBOT in aged C57BL/6 mice brain tissues. (B) Volcano plots showing the differentially expressed genes in HBOT vs. control. Prkaa2 is one of the upregulated genes (p < 0.05, log2FoldChange>0.1). (C) GO terms enrichment analyses of differently genes between in HBOT and control. The squares in the outer ring represent the GO terms. HBOT, hyperbaric oxygen therapy; Con, Control.

