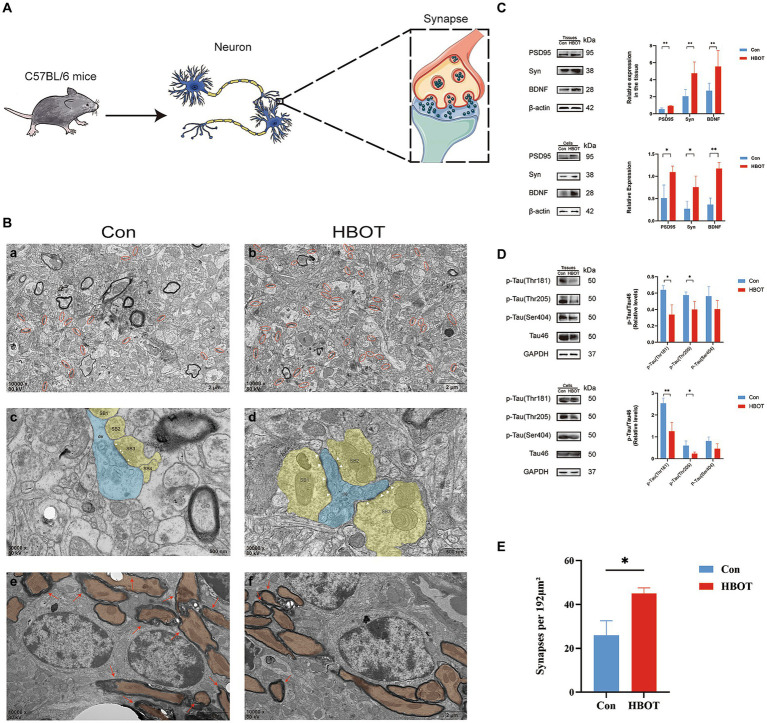
Figure 4.
Effects of HBOT on neurocognitive measures in aged C57 BL/6 mice. (A) Diagram of neuron and synapse in aged C57BL/6 mice. (B) Synapse changes in hippocampus viewed with electron microscopy. (A,B) Synaptic boutons (yellow) on the dendrite (blue) with visible active zones (AZ, white arrowheads) in the HBOT group compared to control. (C,D) Fewer demyelinated lesions (red arrows) seen in the HBOT group. (E,F) Control group has more synaptic junctions (red circles) than HBOT group. Scale bars: (a,b) (500 nm); (c–f) (2 μm). (C) Increased levels of PSD95, BDNF and Syn proteins in aged mice and N2a cells post-HBOT (n = 3/group, *p < 0.05, **p < 0.01). Expression normalized to β-actin. (D) HBOT decreases p-Tau (Thr181, Thr205) levels but leaves Tau46 and p-Tau (Ser404) levels unchanged in aged mice and N2a cells (n = 3/group, *p < 0.05, **p < 0.01). Expression normalized to GAPDH. PSD, postsynaptic density; AZ, active zone; de, dendrite. (E) Statistical analysis of synaptic density. Compared to the Con group, the synaptic density (highlighted in red circles) in the HBOT group is significantly higher per 192 μm2 (n = 3/group, *p < 0.05).

