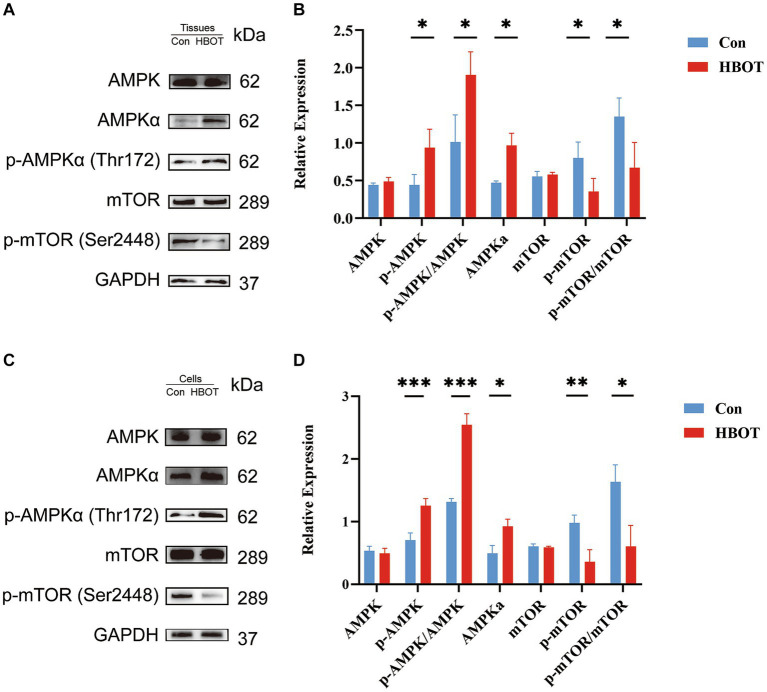
Figure 7.
Impact of HBOT on the protein levels of the AMPK/mTOR pathway. Representative immunoblot bands for m-TOR, p-m-TOR, AMPKα, p-AMPKα in the hippocampal region of the control group and the HBOT group mice are presented (as shown in A). Statistical analyses demonstrated that HBOT increased the level of p-AMPKα and the ratio of p-AMPKα/AMPKα, and decreased the level of p-mTOR and the ratio of p-mTOR/mTOR in the hippocampal region (as shown in B). Similar results were observed when N2a cells were treated with HBOT (C,D). (n = 3/group, *p < 0.05, **p < 0.01, ***p < 0.001).

