
Figure 2.
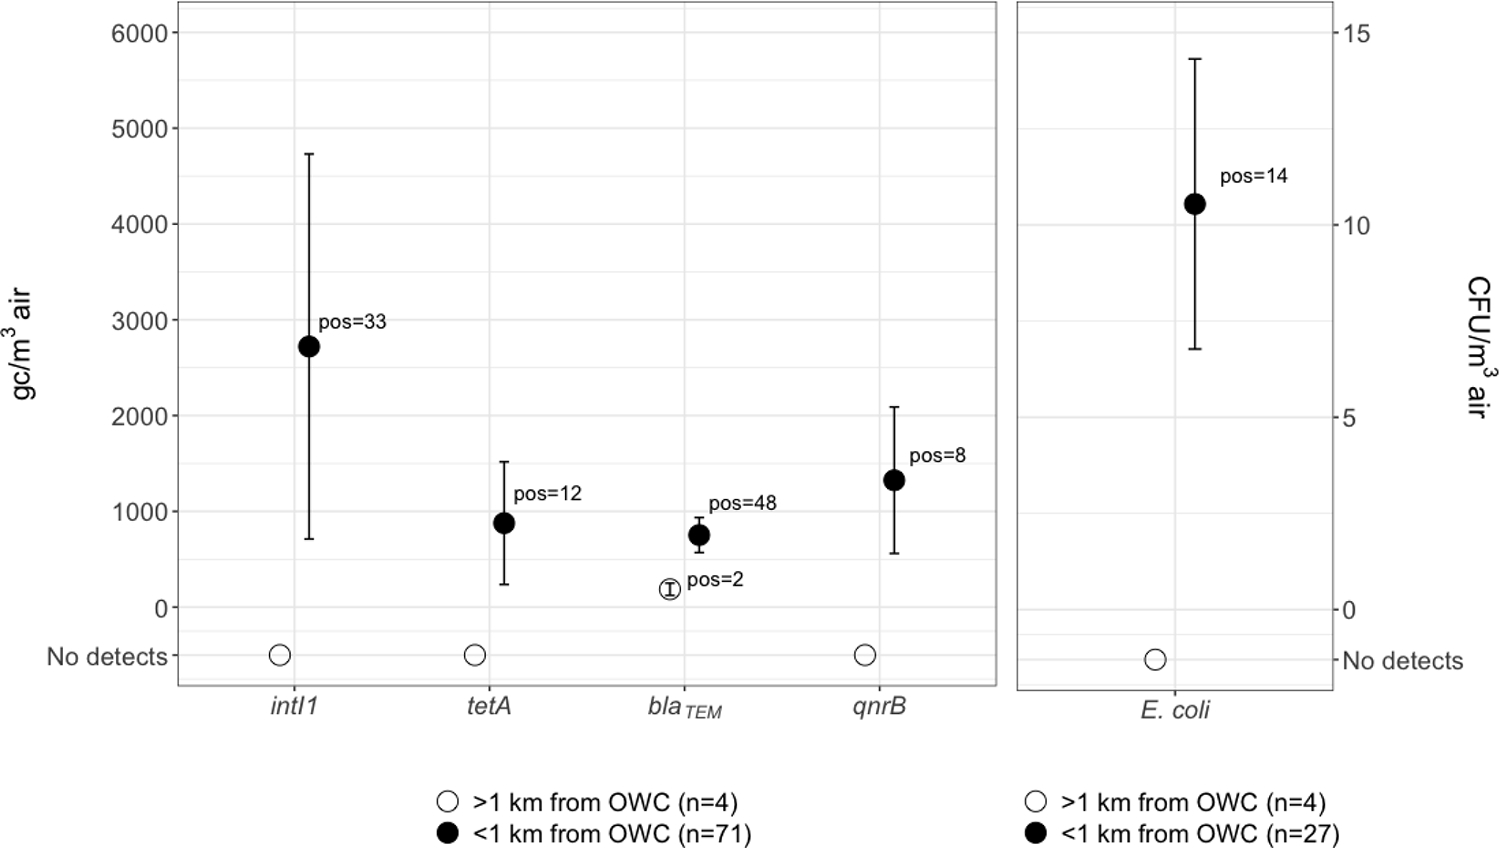
Left: average ARG and MI densities with mean standard error bars for the distribution in gene copies per cubic meter of air, where targets were detected at levels equal to or above the LOD. Right: mean culturable E. coli per cubic meter of air with mean standard error bars for the distribution in coliforming units per cubic meter of air.