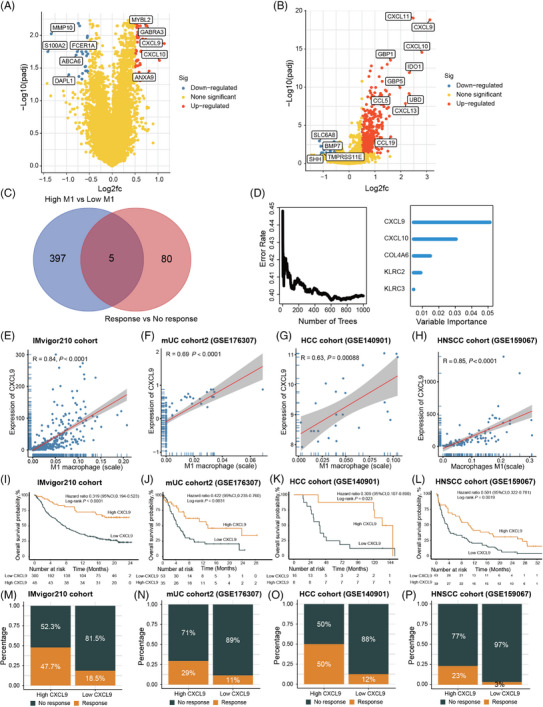
FIGURE 4.

CXCL9 is closely associated with M1 macrophage and plays a significant role in influencing the clinical outcomes of immune checkpoint inhibitors (ICIs). (A) Volcano plot illustrating the differentially expressed genes (DEGs) between the ICI response and nonresponse groups based on the IMvigor210 cohort. (B) Volcano plot displaying the DEGs between the high and low M1 macrophage groups based on the IMvigor210 cohort. (C) Venn diagram depicting the intersection of the two sets of DEGs. (D) Random forest analysis highlighting CXCL9 as the most important feature. (E–H) Spearman correlation analysis demonstrating the correlation between M1 macrophage and CXCL9 expression in the IMvigor210 cohort (E), metastatic urothelial carcinoma (mUC) cohort2 (F), hepatocellular carcinoma (HCC) cohort (G), and head and neck squamous cell carcinomas (HNSCC) cohort (H). (I–L) Kaplan–Meier curves illustrating the overall survival (OS) according to CXCL9 expression in the IMvigor210 cohort (I), mUC cohort2 (J), HCC cohort (K), and HNSCC cohort (L). (M–P) Evaluation of the difference in objective response rate (ORR) between the high and low CXCL9 expression groups in the IMvigor210 cohort (M), mUC cohort2 (N), HCC cohort (O), and HNSCC cohort (P).
