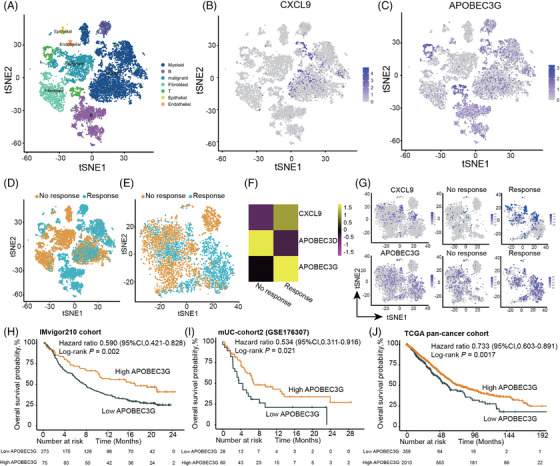
FIGURE 6.

APOBEC3G is identified to be positively correlated with the response to immune checkpoint inhibitors (ICIs) and the tumor immune microenvironment (TIME). (A) Distribution of the seven cell clusters visualized by t‐distributed stochastic neighbor embedding (t‐SNE), colored according to the respective cell clusters. (B) t‐SNE plot displaying the expression levels of CXCL9. (C) t‐SNE plot illustrating the expression levels of APOBEC3G. (D) t‐SNE plot showing two triple negative breast cancer (TNBC) samples stratified based on their response to ICI therapy, with one classified as a responder and the other as a nonresponder. (E) t‐SNE plot highlighting the distinction between responders and nonresponders within the macrophage cluster. (F) Heatmap depicting the expression levels of CXCL9, APOBEC3D, and APOBEC3G between responders and nonresponders within the macrophage cluster. (G) t‐SNE plot demonstrating the expression levels of CXCL9 and APOBEC3G within the macrophage cluster. (H–J) Kaplan–Meier curves depicting the overall survival (OS) based on the expression of APOBEC3G in the IMvigor210 cohort (H), metastatic urothelial carcinoma (mUC) cohort2 (I), and TCGA‐Pancancer cohort (J).
