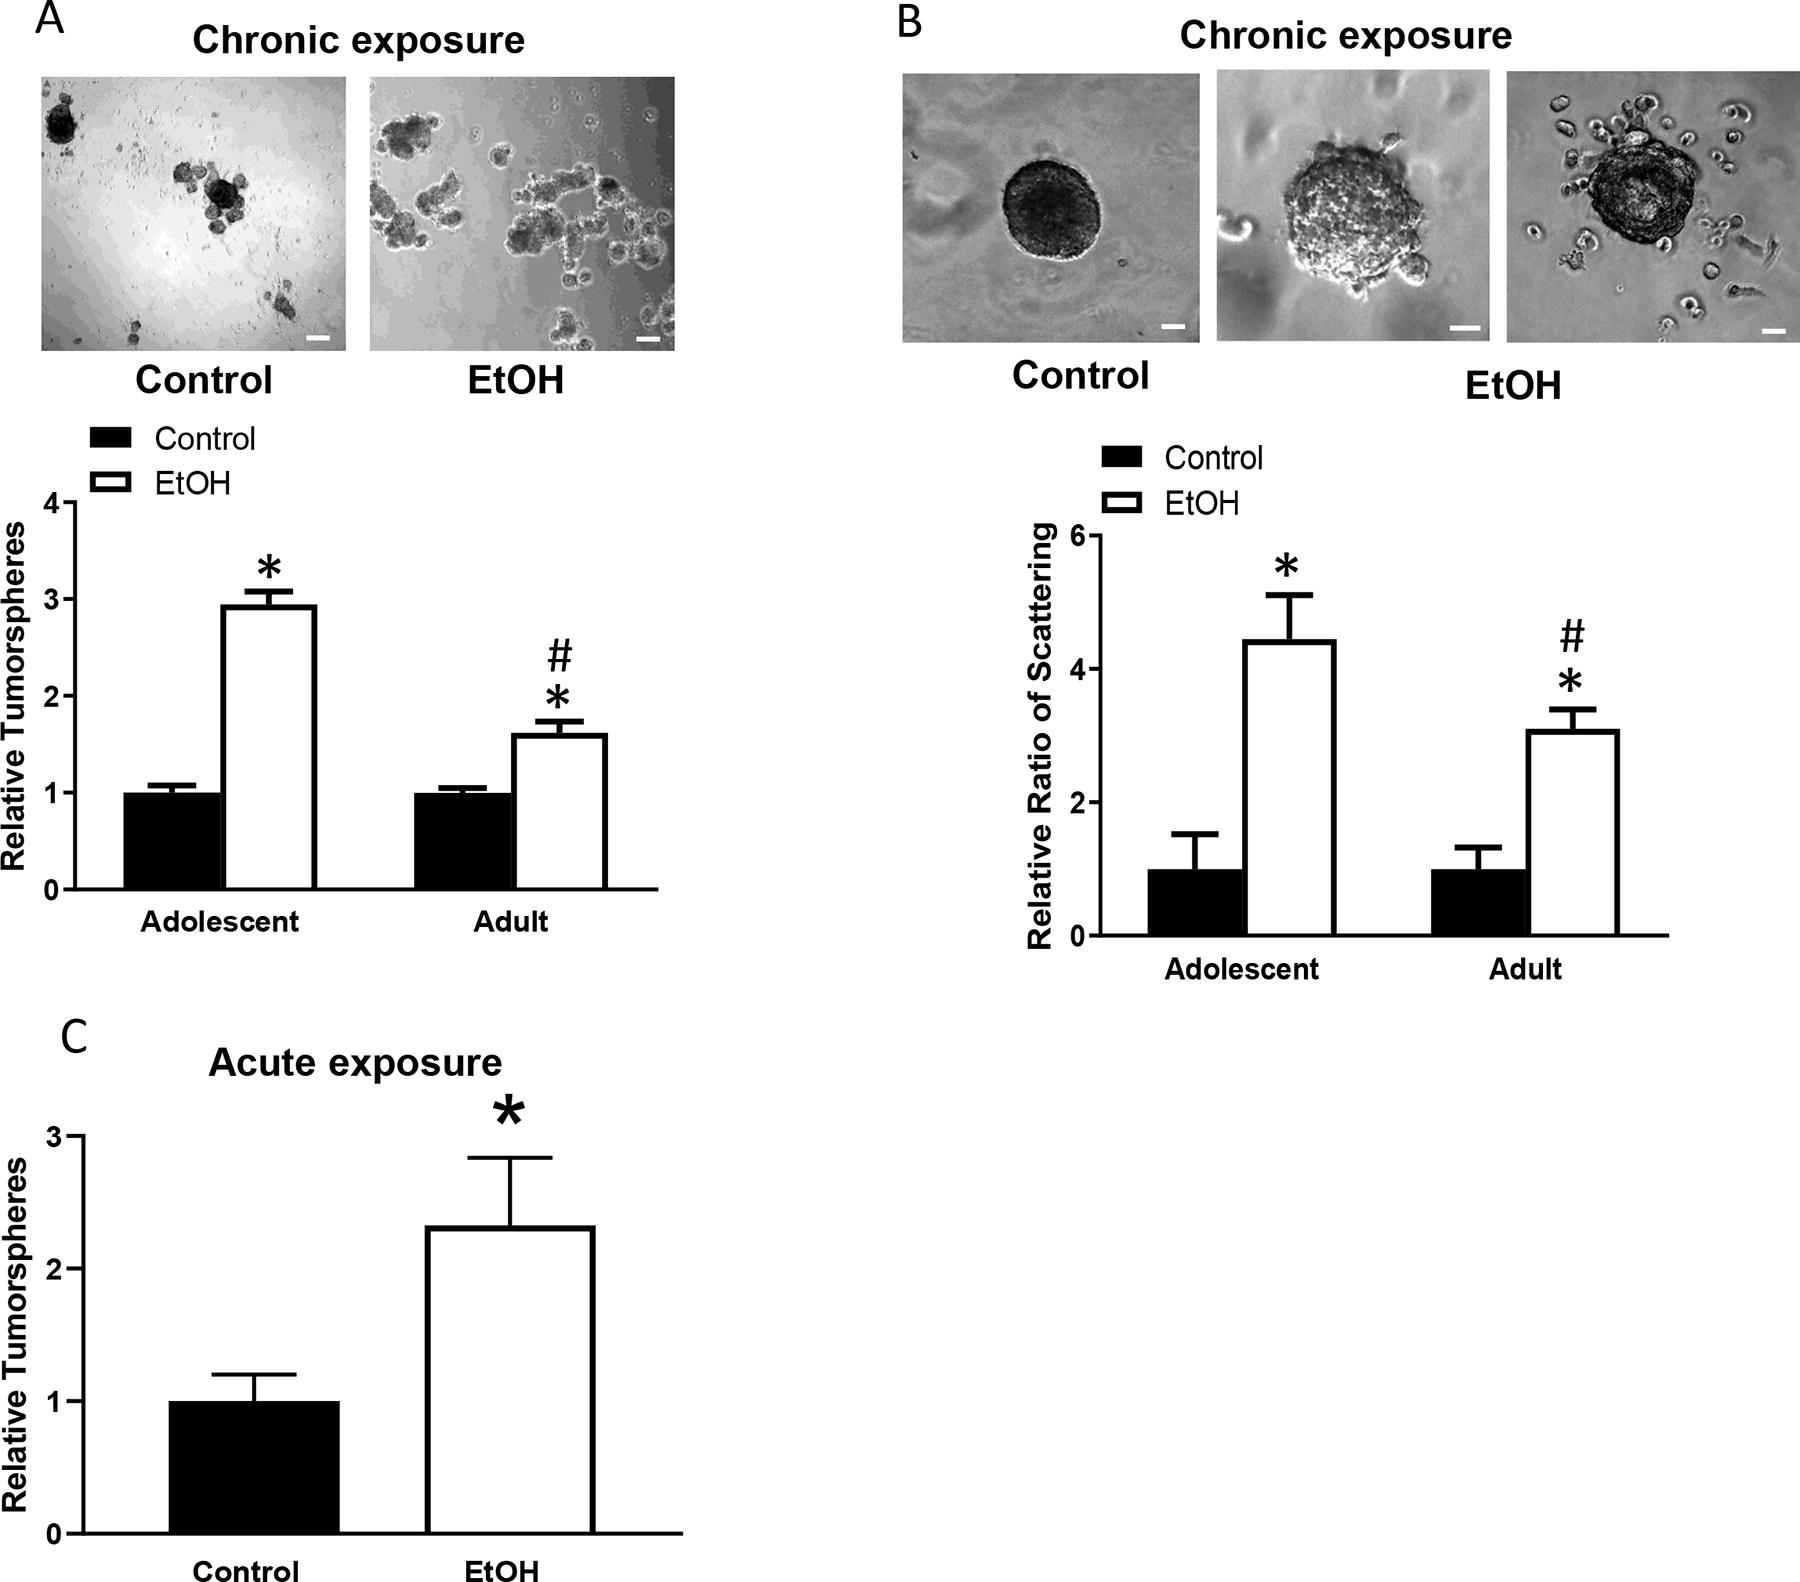
Fig. 4.

Alcohol’s effects on tumorsphere formation and cell scattering. Adolescent and adult MMTV-Wnt1 mice received chronic alcohol exposure through liquid diet or acute alcohol exposure through gavage as described above. Mammary tumor tissues were dissected and assayed for tumorsphere formation and cells scattering as described in the Materials and Methods. A. Tumorsphere formation was determined following chronic alcohol exposure. n = 6 for each group. * significant difference from controls; # significant difference from adolescent alcohol-exposed group, p < 0.05. B. Cell scatting was determined following chronic alcohol exposure. Number of spheroids/well or scattering spheroids was counted. n = 5 for each group, *denotes a significant difference from controls. # significant difference from adolescent alcohol-exposed group, p < 0.05. C. Tumorsphere formation was determined following acute alcohol exposure in adolescent mice. n = 7 for each group. * significant difference from controls. Bar = 50 μm
