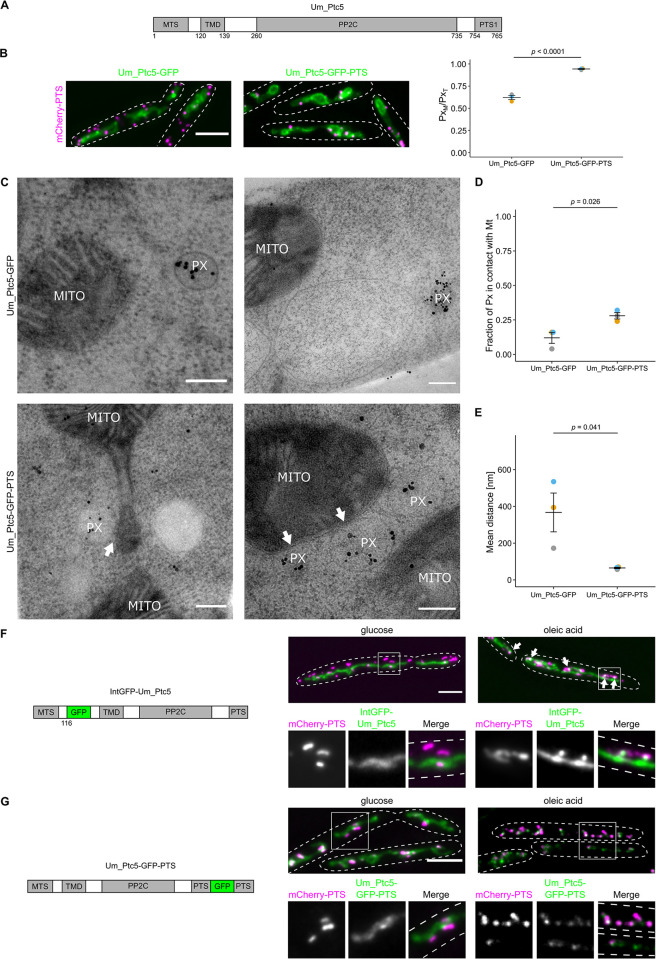
Fig 1. Ultrastructural characterization of Um_Ptc5 induced contacts.
(A) Scheme of U. maydis Ptc5 highlighting the targeting signals (MTS, PTS), a TMD and the phosphatase domain (PP2C). Prediction of the PP2C domain was performed with the HMMER web server. Note that this sequence contains a putative cleavage site between TMD and PP2C, which has been experimentally validated only in yeast so far [11,12]. (B) Cells expressing Um_Ptc5-GFP or Um_Ptc5-GFP-PTS (green) under control of the constitutive Otef-promoter [33] and together with the peroxisomal marker mCherry-PTS (magenta) were analyzed by fluorescence microscopy. (C) Pictures were obtained by TEM. mCherry-PTS was stained via immunogold labeling. White arrows indicate PerMit contacts. Scale bar: 0.2 μm. (D) and (E) Quantifications are based on n = 3 experiments. Each color represents 1 experiment. At least 25 peroxisomes per experiment were analyzed. Error bars represent SEM. P-values were calculated using a two-sided unpaired Student’s t test. (F) Cells expressing an internally GFP-tagged derivative of Um_Ptc5 (green) under control of the endogenous promoter together with the peroxisomal marker mCherry-PTS (magenta) were analyzed by fluorescence microscopy following incubation with indicated carbon sources. Insets show single channels and merged channels. Scale bar: 5 μm. (G) Cells expressing a C-terminally GFP-tagged derivative of Um_Ptc5 preserving the PTS (green) under the control of the endogenous promotor and the peroxisomal marker mCherry-PTS (magenta) were analyzed by fluorescence microscopy following incubation with indicated carbon sources. Insets show single channels and merged channels. Scale bars in fluorescence microscopic images: 5 μm. Underlying data for quantifications can be found in S1 Data. MTS, mitochondrial targeting signal; PTS, peroxisome targeting signal; TEM, transmission electron microscopy; TMD, transmembrane domain.

