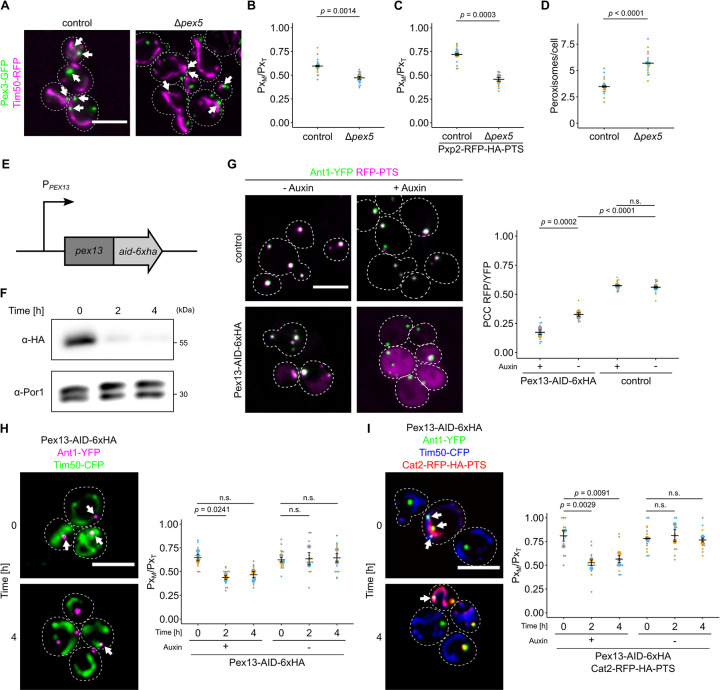
Fig 3. Depletion of components of the peroxisomal import machinery reduces PerMit contacts.
(A) Fluorescence microscopic picture of control and Δpex5 cells expressing endogenously tagged Pex3-GFP (green) and Tim50-RFP (magenta). White arrows denote peroxisomal signal overlapping with mitochondrial signal. (B) Quantification of the fraction of peroxisomes contacting mitochondria (PxM) in relation to the total peroxisome count (PxT) of control cells and Δpex5 cells. (C) Quantification of the fraction of peroxisomes contacting mitochondria (PxM) in relation to the total peroxisome count (PxT) of control cells and Δpex5 cells expressing Pxp2-RFP-PTS, Ant1-YFP, and Tim50-CFP. (D) The number of peroxisomes per cell was quantified in the indicated strains expressing Pex3-GFP. (E) Scheme of the genetic modifications used for auxin-dependent depletion of Pex13 in (F)–(I). The endogenous PEX13 locus was genetically engineered to encode a translational fusion of Pex13 with a C-terminal AID and 6 hemagglutinin (HA) tags. Pex13 degradation is mediated by the F-box protein AFB2 from Arabidopsis thaliana, which was expressed from the ADH1 promotor. (F) Auxin-dependent depletion of Pex13-AID-HA at indicated time points was analyzed by SDS-PAGE and immunoblot. Por1 served as a loading control. (G) Fluorescence microscopic images of indicated strains expressing the peroxisomal membrane protein Ant1-YFP (green) and RFP-PTS (magenta) in the absence (-Auxin) or presence (+Auxin; 4 h) of 2 mM indole-3-acetic acid. (H) Subcellular localization of Ant1-YFP (magenta) and Tim50-CFP (green) of indicated strains was analyzed in the presence of 2 mM indole-3-acetic acid at indicated time points (left). White arrows indicate peroxisomes in proximity to mitochondria. The fraction of peroxisomes in contact with mitochondria (PxM) relative to the total peroxisome count (PxT) of the indicated strain was quantified (right). (I) Identical to (H), except that the cells also expressed Cat2-RFP-HA-PTS (red) to increase PerMit contacts. Scale bars represent 5 μm. Quantifications are based on n = 3 experiments. Each color represents 1 experiment. Error bars represent SEM. A one-way ANOVA combined with a Tukey test was performed to assess statistical significance for multiple comparisons. Otherwise, a two-sided unpaired Student’s t test was performed. Underlying data for quantifications can be found in S1 Data. AID, auxin-inducible degron; PTS, peroxisome targeting signal; RFP, red fluorescent protein.

