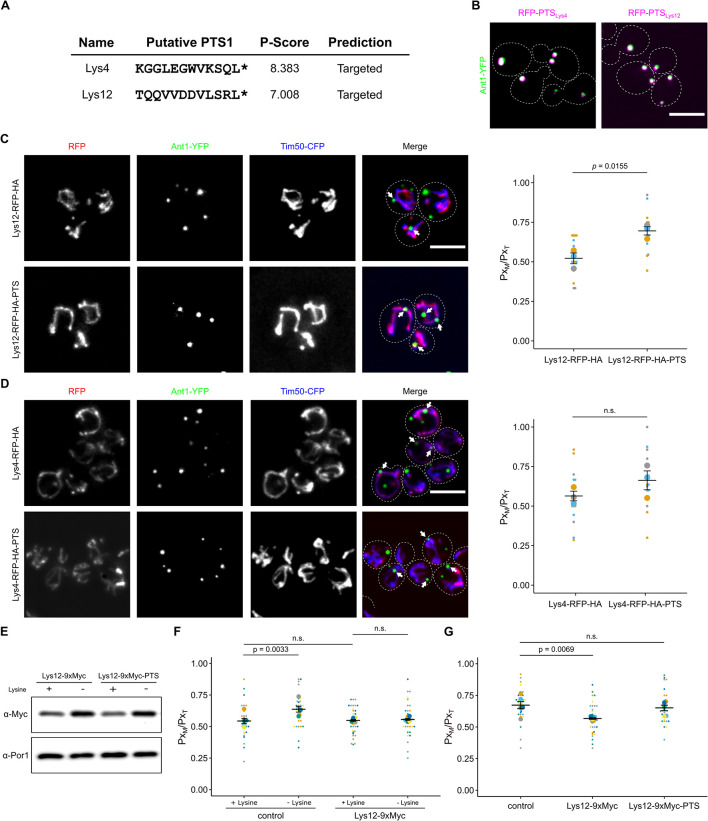
Fig 4. The dual affinity protein Lys12 enhances PerMit contacts upon lysine deprivation.
(A) PTS1 motifs in mitochondrial enzymes Lys4 and Lys12 were predicted using a program from Neuberger and colleagues [40]. (B) C-terminal dodecamers depicted in Fig 4A were fused to RFP (magenta) and tested for peroxisomal localization in strains expressing Ant1-YFP (green). (C) Fluorescence microscopic images of yeast cells expressing either Lys12-RFP-HA or Lys12-RFP-HA-PTS (red) together with the peroxisomal membrane protein Ant1-YFP (green) and the mitochondrial inner membrane protein Tim50-CFP (blue) (left). White arrows denote peroxisomes overlapping mitochondria. Quantification of the fraction of peroxisomes in contact with mitochondria (PxM) relative to the total peroxisome number (PxT) (right). (D) Identical to Fig 4C for Lys4. (E) Immunoblot showing the levels of indicated fusion protein from cells grown with or without lysine. (F) Quantification of the fraction of peroxisomes contacting mitochondria (PxM) in relation to the total peroxisome count (PxT) of control cells and cells endogenously expressing a C-terminally 9xMyc-tagged derivative, which masks the PTS1 of Lys12 grown with or without lysine. (G) Quantification of the fraction of peroxisomes contacting mitochondria (PxM) in relation to the total peroxisome count (PxT) of control cells and cells endogenously expressing a C-terminally 9xMyc-tagged derivative, which either masks or preserves the PTS1 of Lys12 grown with or without lysine. Quantifications are based on n = 3 experiments. Each color represents 1 experiment. Error bars represent SEM. P-values were calculated using a two-sided unpaired Student’s t test. For plots showing multiple comparison, a one-way ANOVA combined with a Tukey test was performed. Scale bars represent 5 μm. Underlying data for quantifications can be found in S1 Data. PTS, peroxisome targeting signal; RFP, red fluorescent protein.

