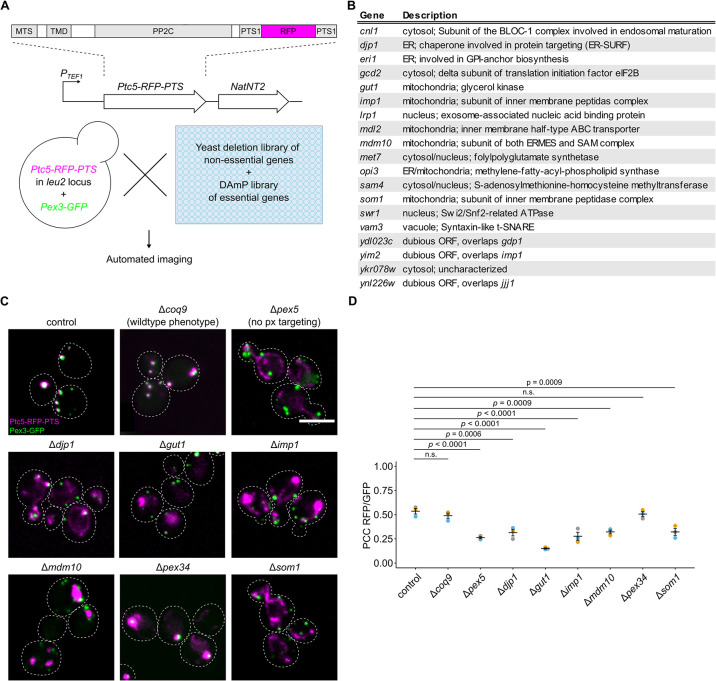
Fig 5. A high-content genetic screen to identify factors involved in targeting of Ptc5 to peroxisomes.
(A) Schematic illustration of a high-content microscopic screen to uncover factors involved in sorting of the protein phosphatase Ptc5. A query strain co-expressing Ptc5-RFP-PTS and Pex3-GFP was crossed into indicated yeast libraries using synthetic genetic array technology. Haploid progeny expressing both fusion proteins in each mutant background were analyzed with automated fluorescence microscopy. MTS, mitochondrial targeting signal; TMD, transmembrane domain; PP2C, protein phosphatase type 2C; PTS1, peroxisomal targeting signal type 1. (B) Table showing a subset of mutants affecting Ptc5 localization. The entire list of mutations is depicted in S2 Table. (C) Subcellular localization of Ptc5-RFP-PTS (magenta) and Pex3-GFP (green) was analyzed in indicated strains using automated fluorescence microscopy. Shown are pictures from experiments performed on putative hits. Δcoq9 cells were used as a control as these show Ptc5-RFP-PTS localization in peroxisomes but are affected in mitochondrial metabolism [11]. Δpex5 mutants show mitochondrial but no peroxisomal signal of the reporter Ptc5-RFP-PTS. Scale bars represent 5 μm. (D) Correlation between Ptc5-RFP-PTS signal and Pex3-GFP signal was quantified in indicated strains. Quantifications are based on n = 3 experiments. Each color represents 1 experiment. Error bars represent SEM. A one-way ANOVA combined with a Tukey test was performed to assess statistical significance. Underlying data for quantifications can be found in S1 Data. PTS, peroxisome targeting signal; RFP, red fluorescent protein.

