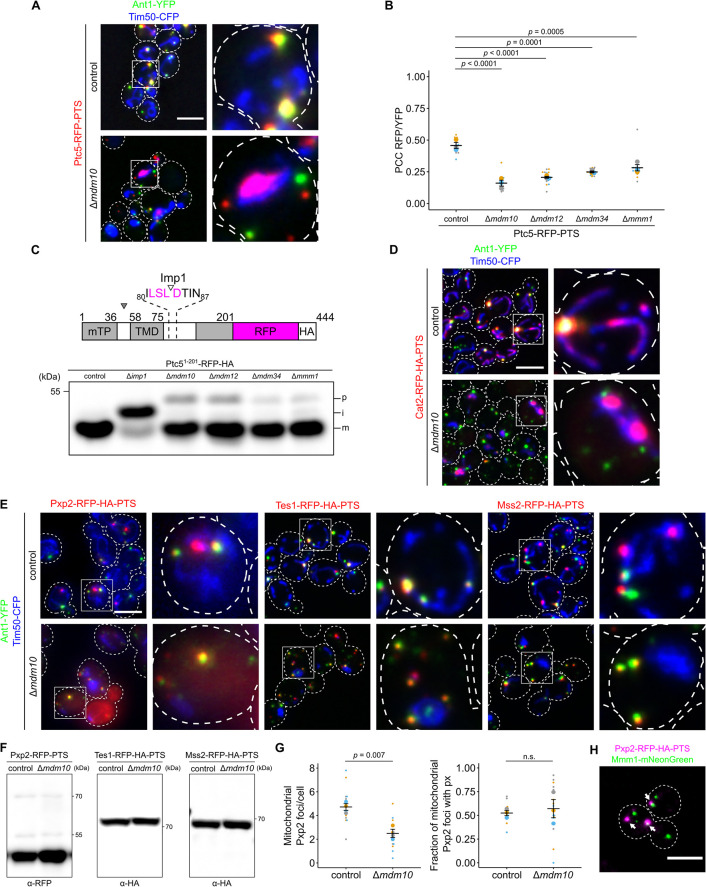
Fig 6. ERMES complex regulates import of proteins into mitochondria and peroxisomes.
(A) Subcellular localization of Ptc5-RFP-PTS (red), the peroxisomal membrane protein Ant1-YFP (green), and the mitochondrial inner membrane protein Tim50-CFP (blue) in control or Δmdm10 cells was analyzed with fluorescence microscopy. (B) Correlation between Ptc5-RFP-PTS signal and Ant1-YFP signal was quantified in indicated strains. (C) The truncated variant Ptc51-201-RFP lacking a PTS1 was expressed in indicated strains. Cleavage sites for MPP (filled arrow) and the IMP complex (blank arrow) are indicated in the scheme. Whole cell lysates were analyzed by SDS-PAGE and immunoblot. p: premature isoform, i: intermediate isoform, m: mature isoform. Concentrations of protein extracts were adapted to each other to focus on processing. (D) Cat2-RFP-HA-PTS (red) was co-expressed with Ant1-YFP (green) and Tim50-CFP (blue) in control or Δmdm10 cells. Subcellular localization was determined with fluorescence microscopy. White arrows denote peroxisomes overlapping mitochondria. (E) Fluorescence microscopic pictures of indicated strains expressing respective RFP fusion proteins (red) together with Ant1-YFP (green) and Tim50-CFP (blue). (F) Whole cell lysates of strains expressing the indicated fusion proteins were analyzed by SDS-PAGE and immunoblot. Concentrations of protein extracts were adapted to each other to focus on processing. (G) The number of Pxp2-positive foci per cell at mitochondria was quantified in indicated strains (left). Quantification of the fraction of mitochondrial Pxp2 foci overlapping Ant1-YFP (right). (H) Fluorescence microscopic picture of a strain expressing Pxp2-RFP-HA-PTS (magenta) together with Mmm1-mNeonGreen (green). White arrows indicate Pxp2-RFP-PTS foci overlapping Mmm1-mNeonGreen foci. Scale bars represent 5 μm. Quantifications are based on n = 3 experiments. Each color represents 1 experiment. Error bars represent SEM. P-values were calculated using a two-sided unpaired Student’s t test. For multiple comparisons, P-values were calculated with a one-way ANOVA combined with a Tukey test. Underlying data for quantifications can be found in S1 Data. ERMES, endoplasmic reticulum–mitochondria encounter structure; IMP, inner membrane peptidase; PTS, peroxisome targeting signal; RFP, red fluorescent protein.

