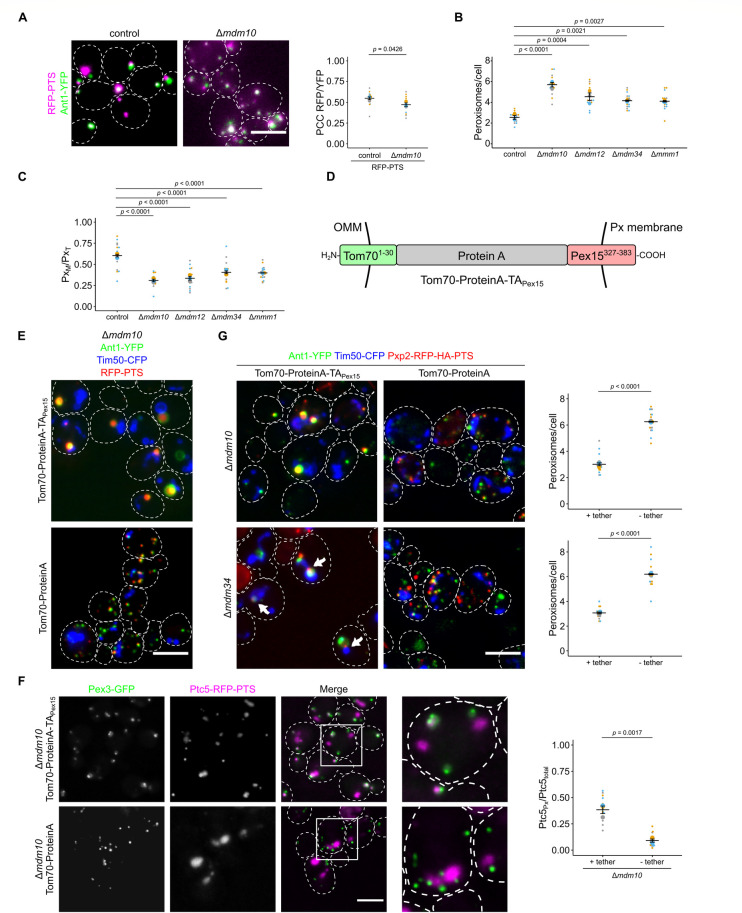
Fig 7. Peroxisome function and proximity to mitochondria is affected in ERMES mutants.
(A) Fluorescence microscopic images of control and Δmdm10 cells co-expressing the peroxisomal marker RFP-PTS (magenta) and the peroxisomal membrane protein Ant1-YFP (green) (left). Correlation of the RFP-PTS signal and the Ant1-YFP signal was quantified using PCC (right). (B) The number of peroxisomes per cell was quantified in indicated strains. (C) Quantification of the ratio of peroxisomes in contact with mitochondria (PxM) to the total peroxisome count (PxT) in indicated strains. (D) Scheme of the synthetic PerMit tether. OMM, outer mitochondrial membrane; Px, peroxisome; TA, tail-anchor. (E) A synthetic tether for peroxisomes and mitochondria (Tom70-ProteinA-TAPex15) can suppress accumulation of small peroxisomes. Fluorescence microscopic images of strains deleted for MDM10 expressing RFP-PTS (red) and the marker proteins Ant1-YFP (green) and Tim50-CFP (blue) in presence of the tether Tom70-ProteinA-TAPex15 or a control protein. (F) Fluorescence microscopic images of Δmdm10 cells expressing Ptc5-RFP-PTS (magenta) and Pex3-GFP (green) together with the tether Tom70-ProteinA-TAPex15 or a control protein. Quantifications show the ratio of peroxisomal versus total Ptc5-RFP-PTS signal. (G) Fluorescence microscopic images of strains deleted for MDM10 expressing Pxp2-RFP-PTS (red) and the marker proteins Ant1-YFP (green) and Tim50-CFP (blue) in presence of the tether Tom70-ProteinA-TAPex15 or a control protein. Arrows indicate Pxp2-RFP-PTS foci located at junctions between mitochondria and peroxisomes in Δmdm34 cells. Quantification of the number of peroxisomes per cell of the indicated strains (right). Scale bars represent 5 μm. Quantifications are based on n = 3 experiments. Each color represents 1 experiment. Error bars represent SEM. P-values were calculated using a two-sided unpaired Student’s t test. For multiple comparisons, P-values were calculated with a one-way ANOVA combined with a Tukey test. Underlying data for quantifications can be found in S1 Data. ERMES, endoplasmic reticulum–mitochondria encounter structure; PCC, Pearson’s correlation coefficient; PTS, peroxisome targeting signal; RFP, red fluorescent protein.

