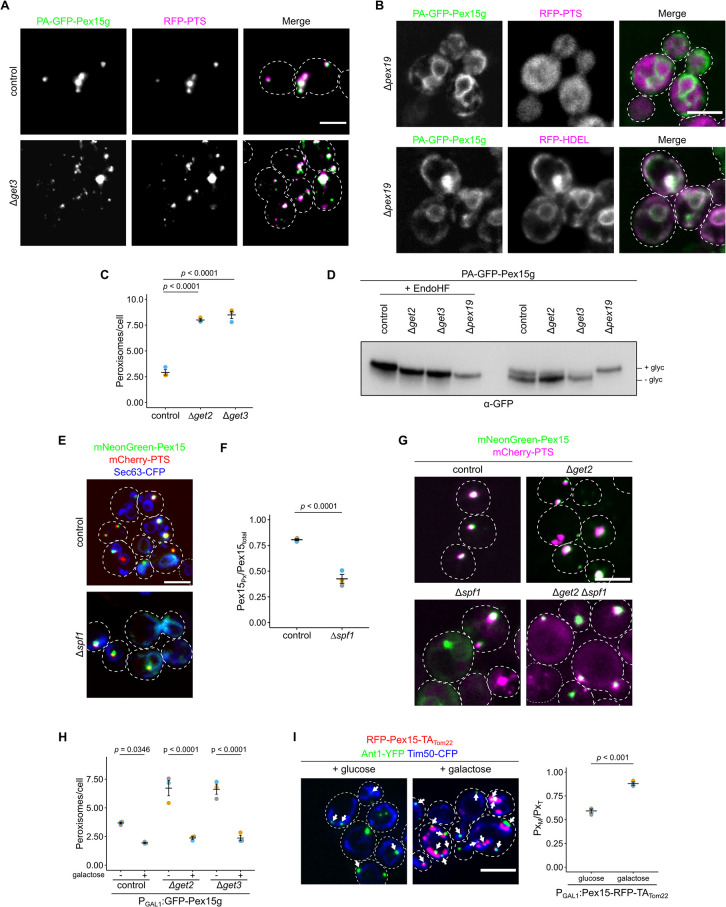
Fig 8. Dual targeting of Pex15 supports ER-peroxisome contacts.
(A) Fluorescence microscopic images of control and Δget3 cells expressing PA-GFP-Pex15g (green) and RFP-PTS (magenta). (B) Localization of PA-GFP-Pex15g (green) in the ER in cells lacking the chaperone and targeting factor Pex19. RFP-HDEL (magenta) is a marker protein for the ER; RFP-PTS (magenta) is a marker for peroxisomes. (C) Quantification of peroxisome number of indicated strains expressing the peroxisomal marker mCherry-PTS. (D) Proteins extracted from indicated strains were subjected to high-resolution SDS-PAGE and immunoblot to visualize glycosylation of PA-GFP-Pex15g. To confirm glycosylation, extracts were treated with endoglycosidase H (EndoHF). (E) Fluorescence microscopic images of control and Δspf1 cells expressing mNeonGreen-Pex15 (green), mCherry-PTS (magenta), and Sec63-CFP (blue). (F) Quantification of the mNeonGreen-Pex15 signal distribution in strains shown in (D). (G) Fluorescence microscopic images of control and indicated mutant cells expressing mNeonGreen-Pex15 (green) and mCherry-PTS (magenta). (H) Quantification of peroxisome number of indicated strains either grown in glucose medium or galactose medium for 3 h to induce expression of GFP-Pex15g. (I) Induced expression of the chimeric protein RFP-Pex15-TATom22 (magenta) in cells expressing Ant1-YFP (green) and Tim50-CFP (blue) (left). Quantification of the number of peroxisomes proximal to mitochondria (right). White arrows specify peroxisomes close to mitochondria. Scale bars represent 5 μm. Quantifications are based on n = 3 experiments. Each color represents 1 experiment. Error bars represent standard error of the mean. P-values were calculated using a two-sided unpaired Student’s t test. For multiple comparisons, a one-way ANOVA combined with a Tukey test was performed. Underlying data for quantifications can be found in S1 Data. ER, endoplasmic reticulum; PTS, peroxisome targeting signal; RFP, red fluorescent protein.

