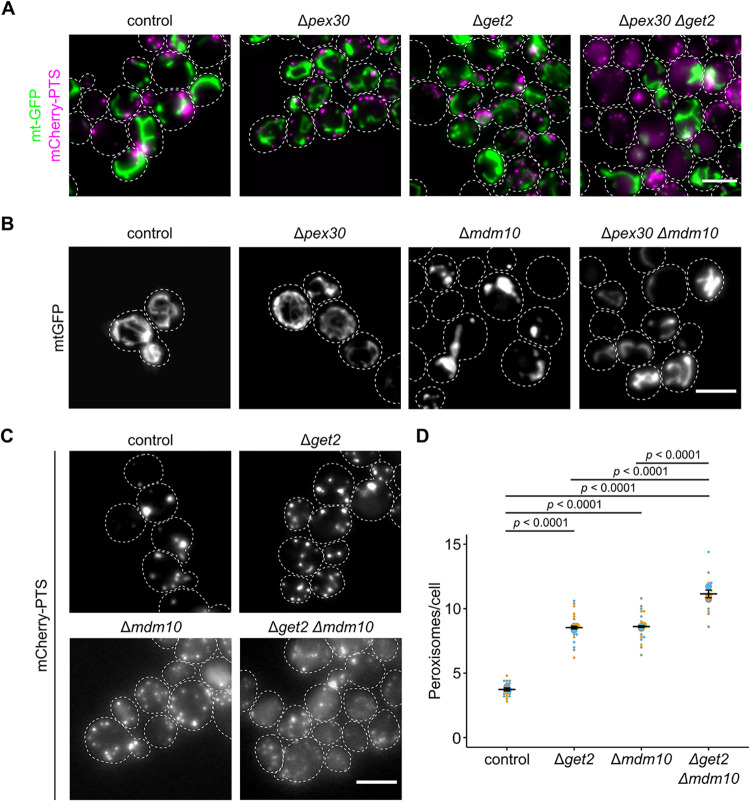
Fig 9. Synthetic genetic interactions reveal redundant modes of tethering.
(A) Fluorescence microscopic images of indicated strains expressing the peroxisomal marker mCherry-PTS (magenta) and the mitochondrial marker mt-GFP (green). (B) Fluorescence microscopic images of indicated strains expressing the mitochondrial marker mt-GFP. (C) Fluorescence microscopic images of indicated strains expressing the peroxisomal marker mCherry-PTS. (D) Quantification of the peroxisome number in indicated strains. Scale bars represent 5 μm. Quantifications are based on n = 3 experiments. Each color represents 1 experiment. Error bars represent standard error of the mean. P-values were calculated using a two-sided unpaired Student’s t test. Underlying data for quantifications can be found in S1 Data. PTS, peroxisome targeting signal.

