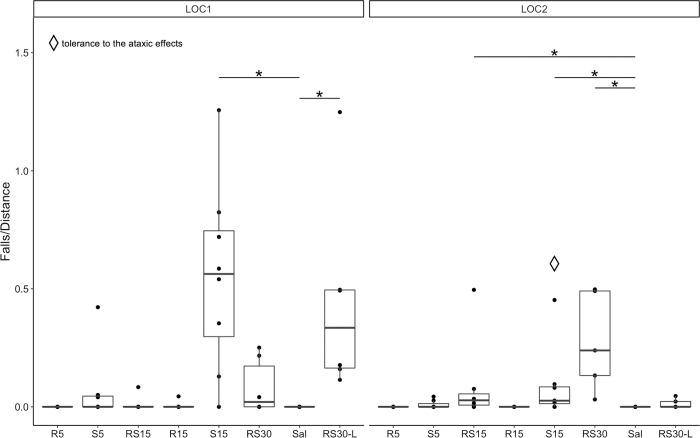
Fig 4. Relative number of falls after initial and repeated treatment with R-ketamine, S-ketamine, and racemic ketamine.
Relative number of falls: comparing treatment groups with a control group during LOC1 (left) and LOC2 (right). * indicates a statistically significant difference, p < 0.05. Diamond shape—significant decrease in relative number of falls on LOC2 compared to LOC1 (tolerance to the ataxic effects), p < 0.05. R5–5 mg/kg of R-ketamine; S5–5 mg/kg of S-ketamine; RS15–15 mg/kg of racemic ketamine; R15–15 mg/kg of R-ketamine; S15–15 mg/kg of S-ketamine; RS30–30 mg/kg of racemic ketamine; Sal—saline; RS30-L—last 15 minutes of 30 mg/kg of racemic ketamine.

