Figure 8.

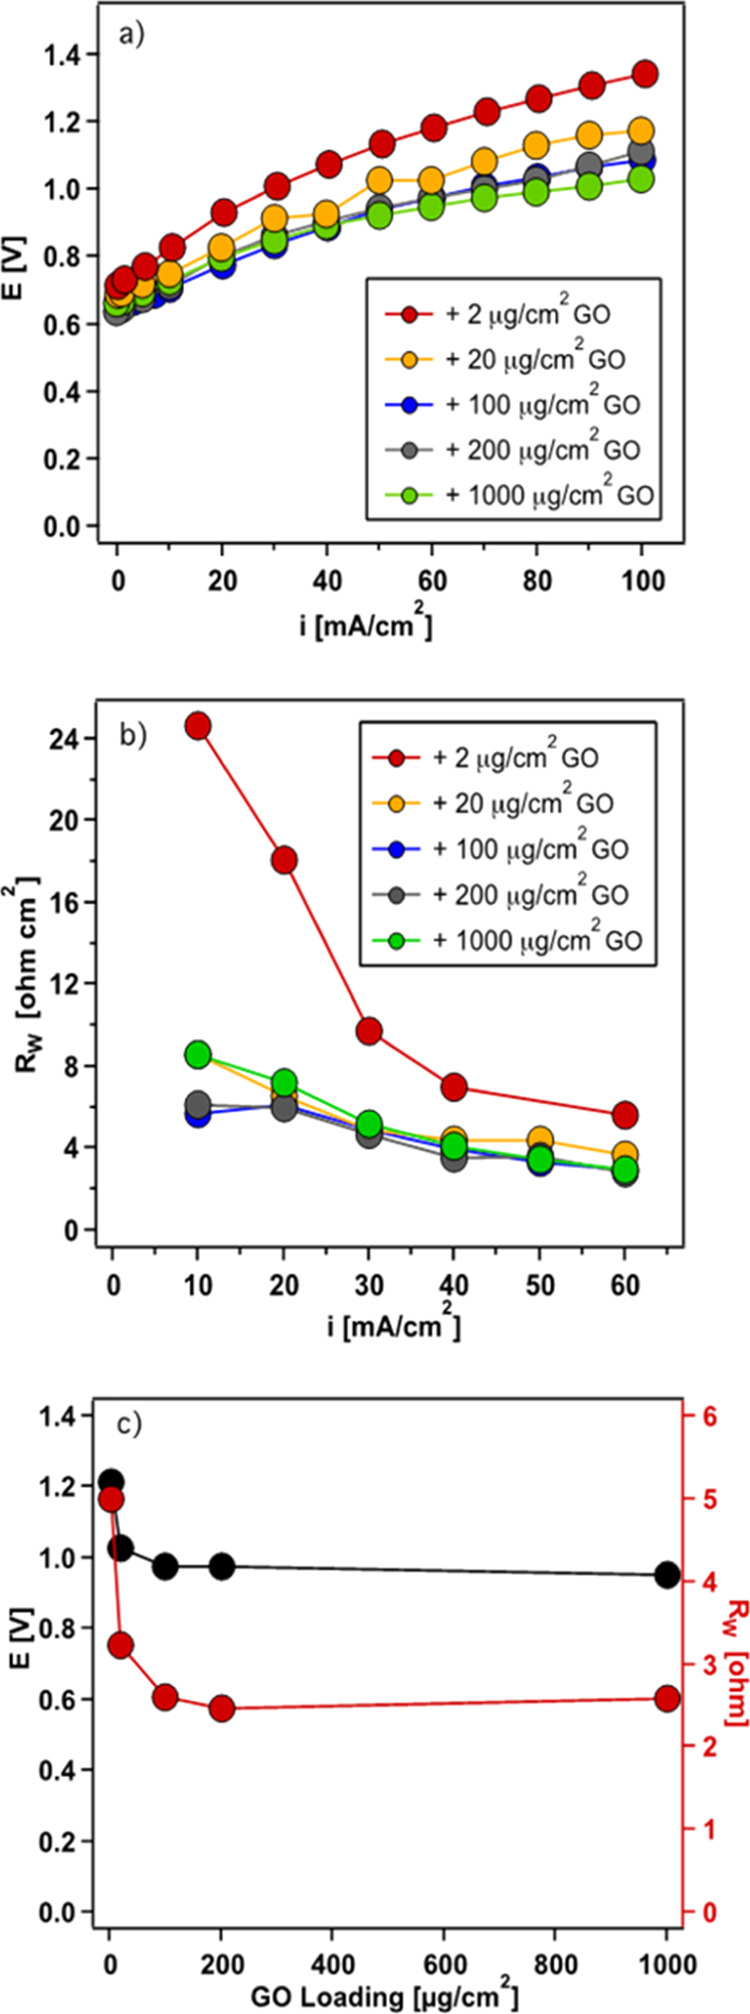
(a) V–I curves and (b) Rw of catalyzed 2D BPM. (c) Voltage (black circle) and Rw (red circle) at 60 mA cm2 as a function of the GOx loading in the BPM junction.

(a) V–I curves and (b) Rw of catalyzed 2D BPM. (c) Voltage (black circle) and Rw (red circle) at 60 mA cm2 as a function of the GOx loading in the BPM junction.