
Figure 1.
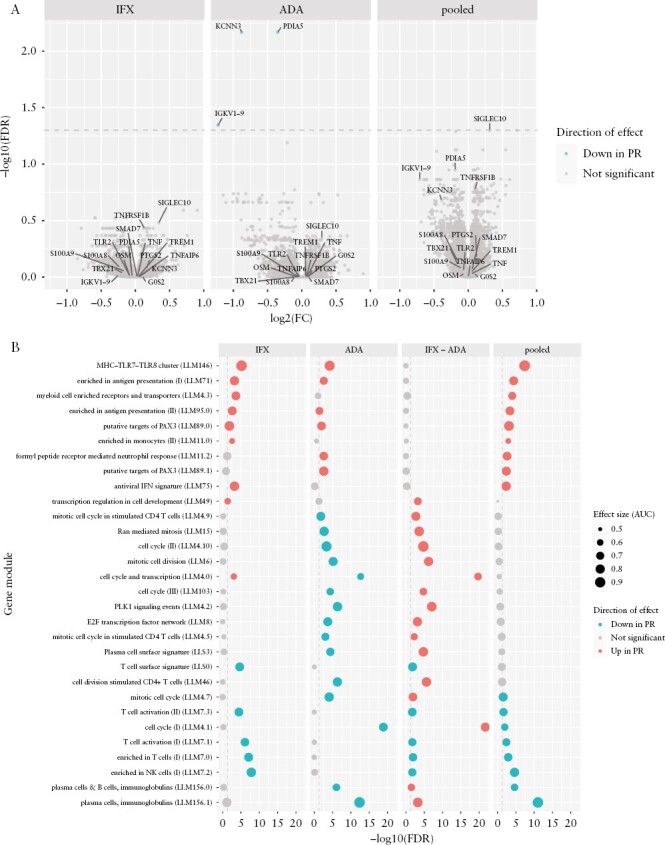
Baseline expression associated with primary response. [A] Volcano plots of differential gene expression between responders [PR] and non-responders [PNR] at week 0: for infliximab [IFX], adalimumab [ADA], or with drug subgroups pooled. Annotated genes show significant associations from this study and previously reported associations from the literature in both blood and gut biopsies. Dashed line shows significance threshold at FDR = 0.05. [B] Top gene modules differentially expressed between PR and PNR at week 0. Columns correspond to results for IFX, ADA, difference between IFX and ADA [IFX − ADA, i.e. the drug-by-response interaction], and pooled drug analyses. The top 30 modules ranked by minimum FDR in any column are shown. Dashed lines show significance thresholds at FDR = 0.05.