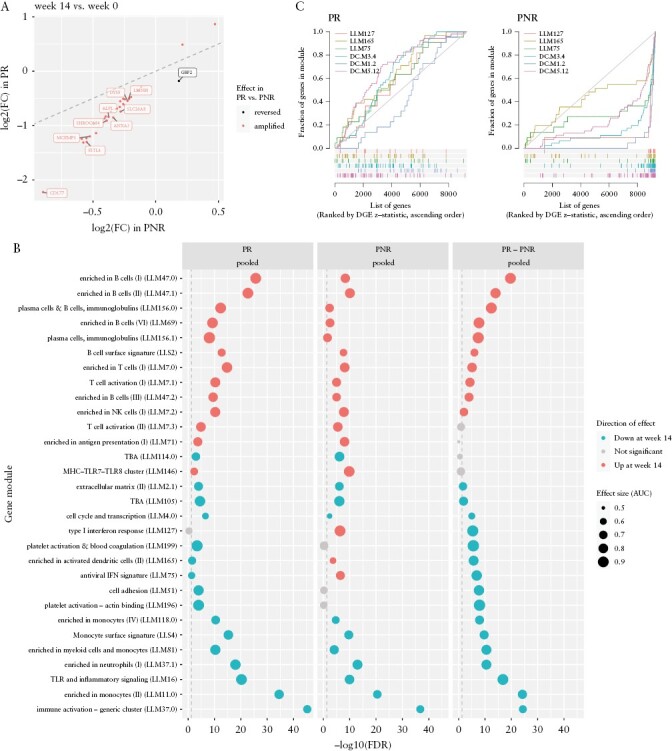
Figure 2.

Expression changes from baseline to post-induction in responders and non-responders. [A] Expression log2 fold changes from week 0 to week 14 in primary responders [PR] and non-responders [PNR], for genes that were differentially expressed from week 0 to week 14 in both responders and non-responders, with a significantly different effect size between responders and non-responders [top ten labelled]. The identity line is shown by the dashed line. [B] Top modules differentially expressed between week 14 and week 0. Columns show effects in PR, PNR, and the PR minus PNR difference [the timepoint-by-response interaction]. The top 30 modules ranked by minimum FDR in any column are shown. Vertical dashed line shows significance threshold at FDR = 0.05. [C] Barcode plots showing interferon modules upregulated from week 0 to week 14 in PNR, but not in PR. Genes are ranked in ascending order by week 14 vs week 0 DGE z-statistic, with coloured bars indicating the rank of genes in a module. Curves show the cumulative fraction of genes in a module at a particular rank threshold. The area under the curve [AUC] reflects the effect size of the module association. Diagonal line shows the null of randomly distributed ranks. Modules sourced from Li et al.37 [prefixed ‘LI’] and Chaussabel et al.38 [prefixed ‘DC’].
