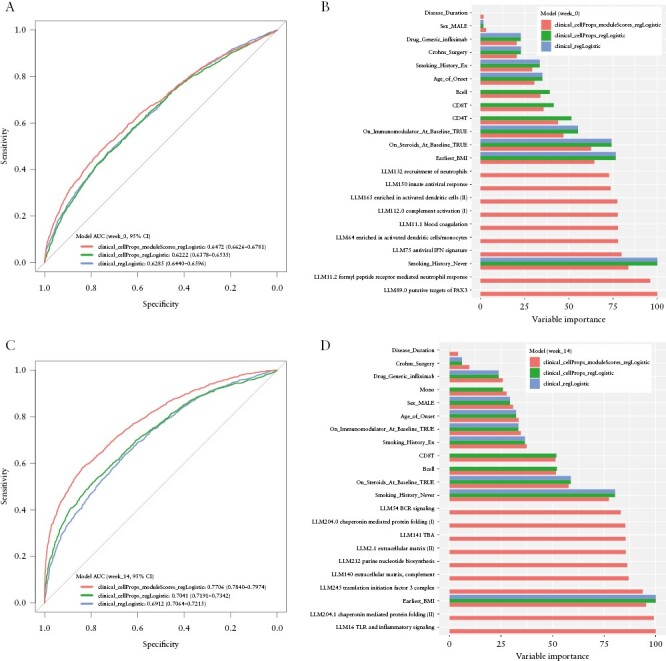
Figure 4.

Prediction of response status from clinical variables, cell proportions, and expression data. Receiver operating characteristic [ROC] curves for the caret regLogistic method40 trained on each predictor dataset are shown at baseline [A] and week 14 [C]. ROC curves were plotted after merging all 50 resamples. Primary non-response was used as the positive class. DeLong 95% confidence intervals for the AUC are shown. The ten most important variables from models trained on each predictor dataset are shown for baseline [B] and week 14 [D] models. The overall variable importance score is computed from the absolute value of the t-statistic for each predictor from the final tuned models. Missing bars denote variables that were not in the predictor dataset for that model.
