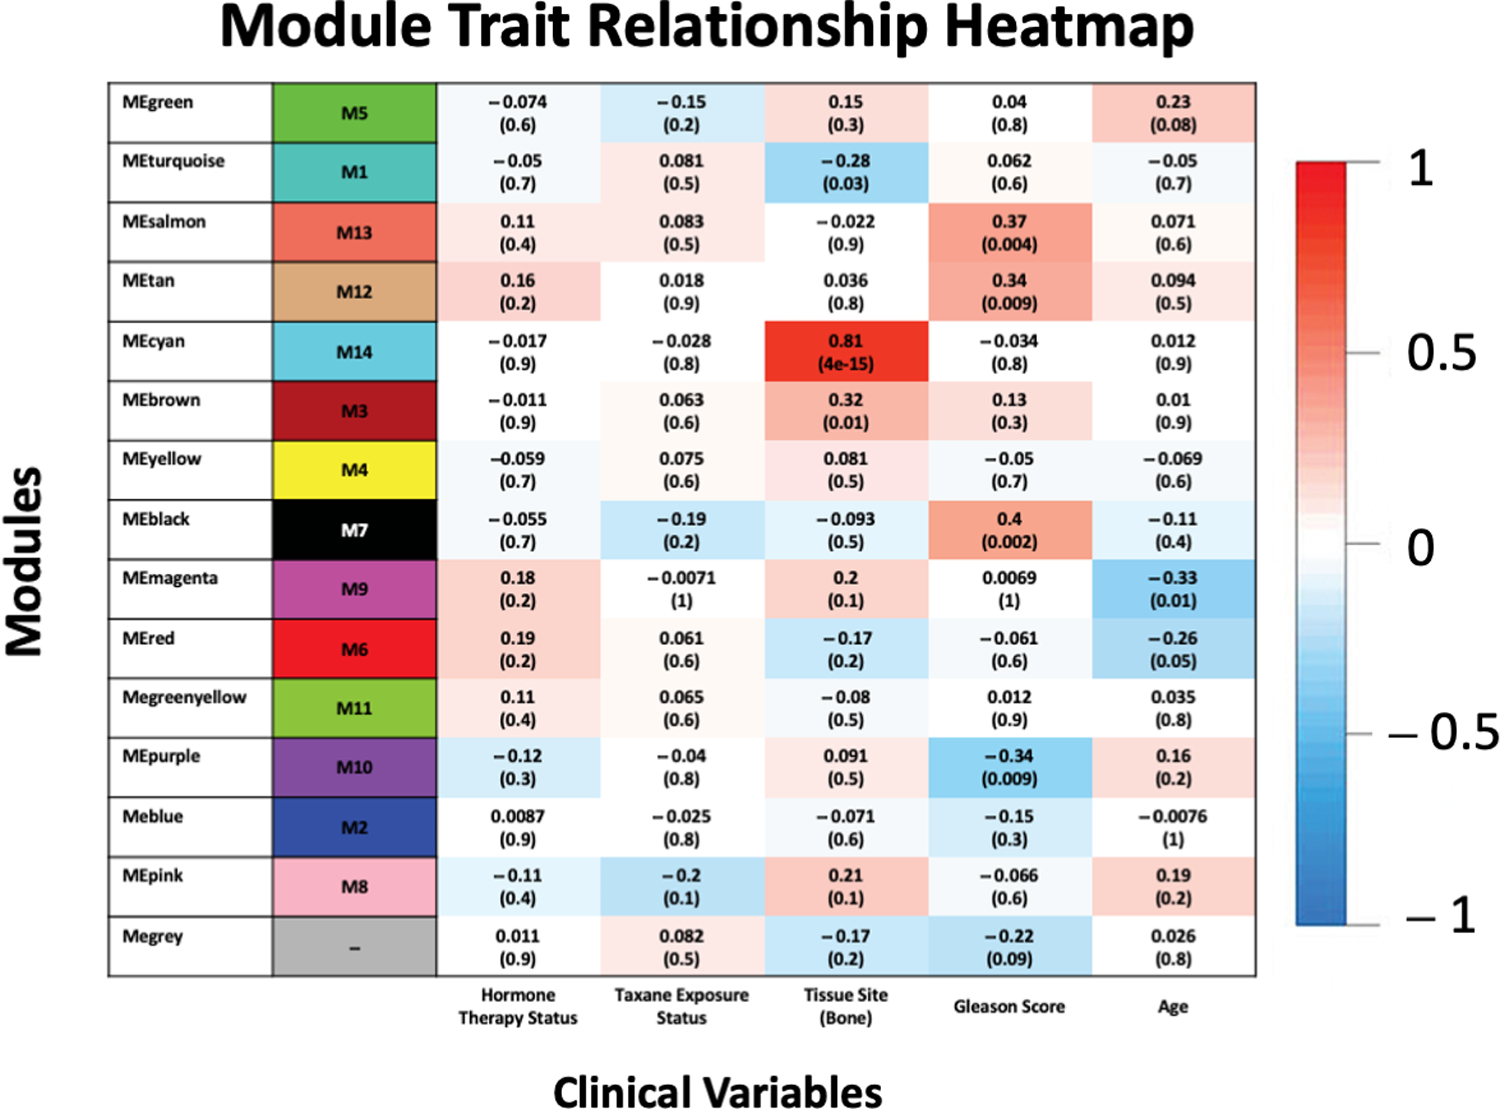
Figure 2.

Module trait relationship. Listed in the heatmap are Pearson rho correlations and p-values (in parentheses) defining the relationship between ME expression and clinical traits. Each row in the table corresponds to a module with the color shown on the left, and each column corresponds to a specific clinical trait.
