Figure 5.


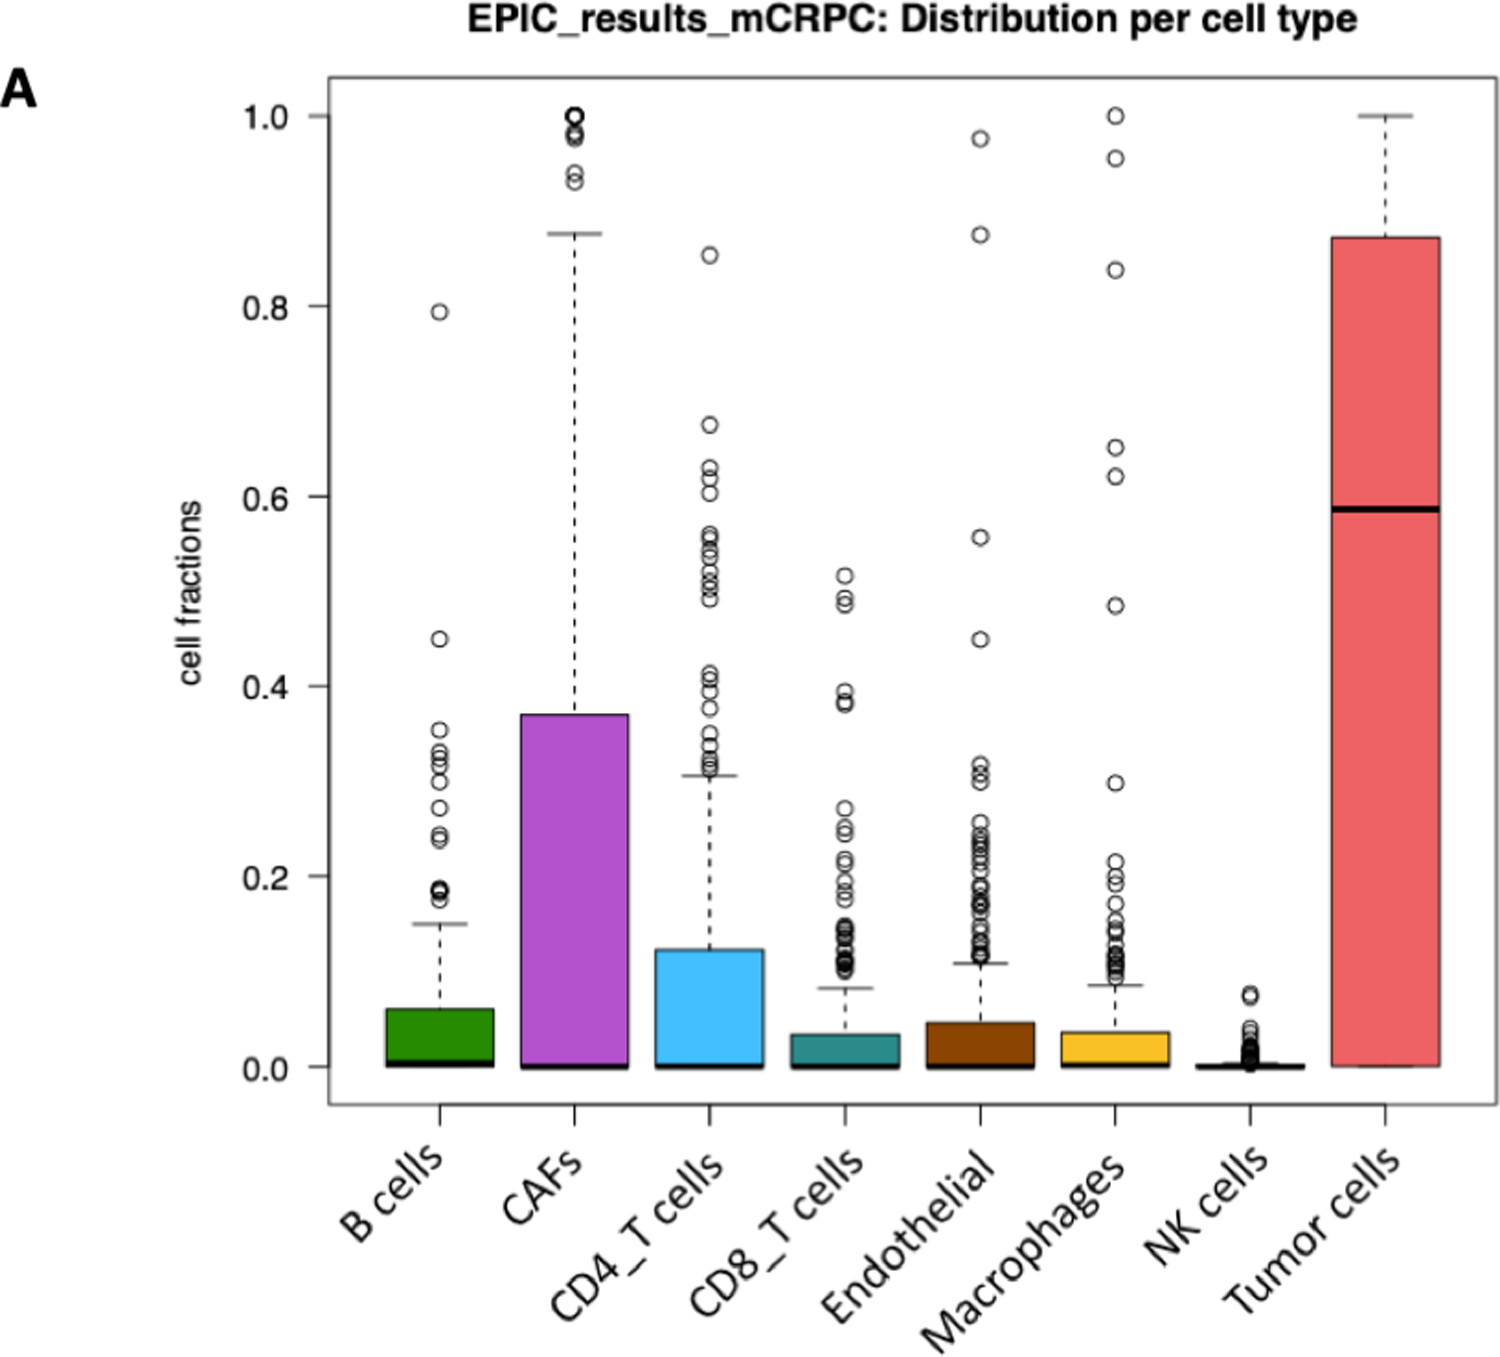
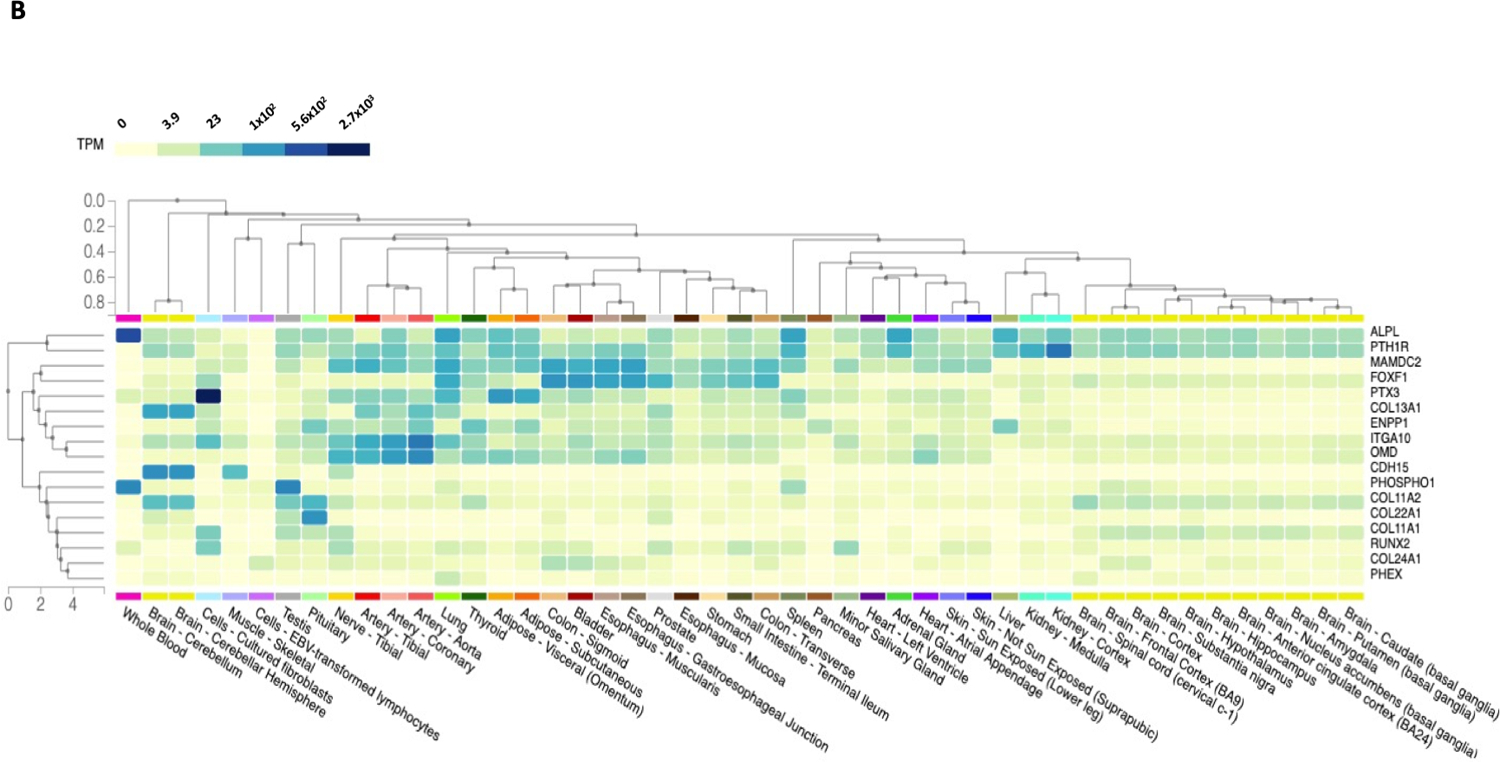
Distribution of tissue cell types and gene expression levels of hub genes across various tissue types. (a) The distribution of each cell type (B-cells, cancer-associated fibroblasts (CAFs), CD4 T-cells, CD8 T-cells, endothelial cells, macrophages, NK cells, and tumor cells) among mCRPC samples in the current dataset; (b) the hierarchical clustering of the diseases is shown as a dendrogram by column. The hierarchical clustering of the select differentially expressed genes is shown as a dendrogram by row. The center plot shows a correlation heat map of gene expression levels by genotype-tissue expression (GTEx) profiles. Gene and transcript expressions on the GTEx portal are shown in transcripts per million (TPM).
