
Figure 6.
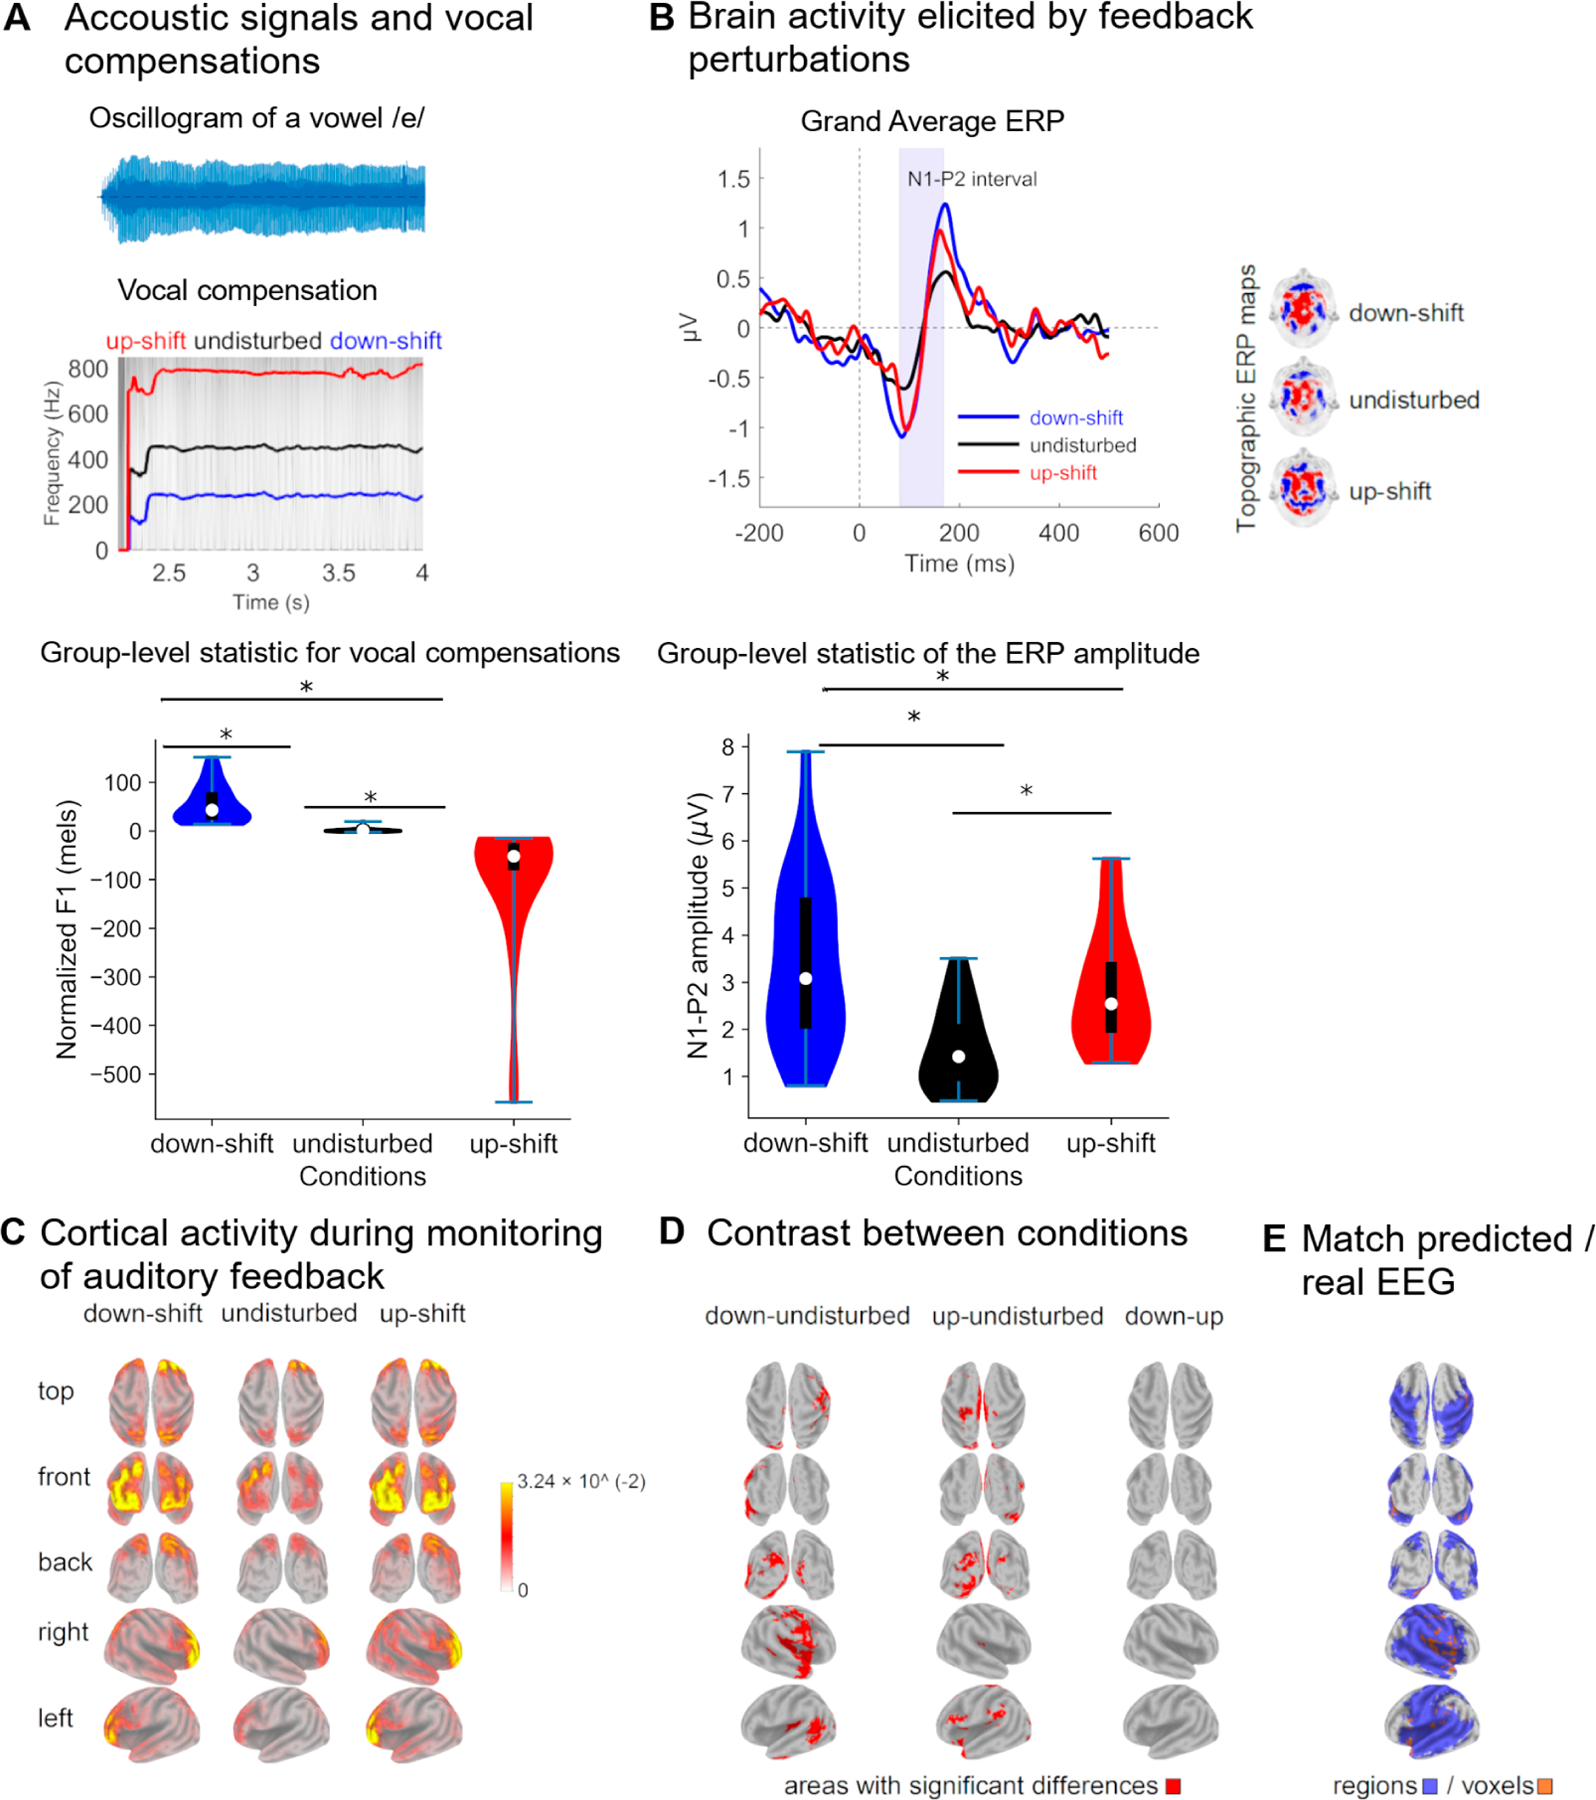
Acoustic and electrophysiological parameters describing the monitoring of one’s own vocalization. (A) Examples of vocal compensations elicited by F1 perturbations in the auditory feedback. In the left panel, an oscillogram representative of the phoneme /mes/ is illustrated. Likewise, the direction of the perturbation is indicated at the top of each chart. The mean F1 values of vocalizations produced in unperturbed acoustic conditions and those of vocal compensations to perturbed auditory feedback are presented in the right panel, along with the corresponding sample distributions. (B) Event-related potential (ERP) elicited by actively monitoring the auditory feedback of one’s own vocalizations. In the left panel, the grand average of the ERP elicited by both unperturbed and F1-shifted auditory feedback are presented. The shaded area indicates the N1-P2 complex. Scalp topography of the N1-P2 complex is illustrated in the middle panel. The mean amplitude of the N1-P2 complex elicited by unperturbed and perturbed auditory feedback are presented in the right panel, along with the corresponding sample distribution. (C) Current density maps illustrating the brain generators of the N1-P2 complex in the different conditions (unperturbed and perturbated auditory feedback). (D) Differences in the cortical activity obtained in response to unperturbed and perturbated auditory feedbacks. The difference between the current density maps elicited by F1 perturbations of equal magnitude and opposite directions is presented in the right panel. (E) Cortical sources of the N1-P2 complex elicited in response to F1 perturbations in the auditory feedback of one’s own vocalizations that are predicted by the DIVA model. They are illustrated both areas and voxels for which the activity predicted by the model overlapped that estimated from the real EEG. Statistically significant differences between groups are represented by *.