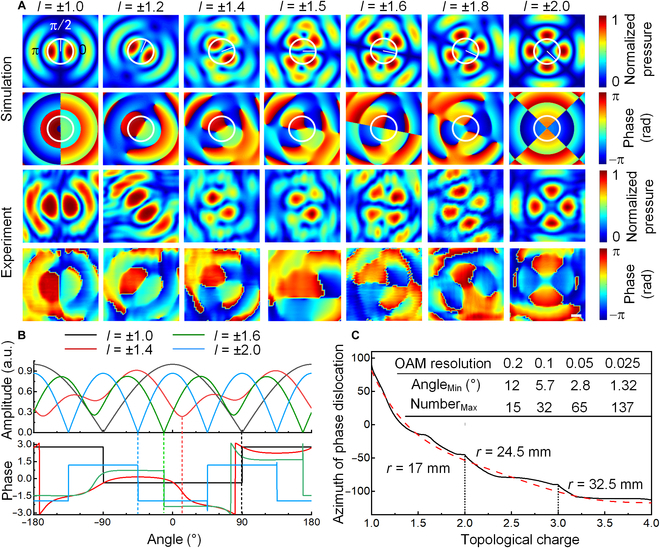
Fig. 2.

Feature analysis of coupled FAVs with l = ± 1.0 to ± 2.0. (A) Numerical and experimental cross-sectional distributions of pressure and phase for FAVs with P-FOAMs. The white ring indicates the circle of sparse sampling with r = 17 mm, which is the averaged radius of the pressure peaks for l = ±1 and ±2. (B) Sampled circular profiles of pressure and phase at z0 = 250 mm (29.41λ). (C) Simulated azimuthal distribution of the phase dislocation as a function of the TC with l = 1 to 4 at the OAM resolution of 0.01 (solid black line), with the fitted curve being presented as the red dashed line. The embedded table in (C) shows the relationship between the OAM resolution, the sampling number, and the minimum angle interval. Scale bar, 1 cm. a.u., arbitrary units.
