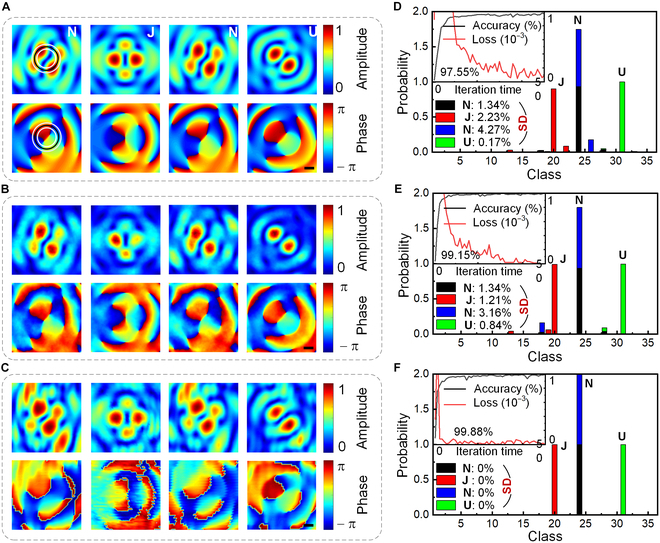
Fig. 3.

Recognition of P-FOAMs for transmitting letters “NJNU” using various circular sampling methods. Simulated cross-sectional distributions of pressure and phase at z0 = 29.41λ (A) without and (B) with turbulence and (C) the corresponding experimental results. Distributions of the probability (histogram), loss (red curve), and classification accuracy (black curve) with respect to the iteration time (top left), and the SDs for the sampling methods of (D) 16-point single-ring, (E) 32-point single-ring, and (F) 32-point dual-ring. Scale bars, 1 cm.
