
Fig. 4.
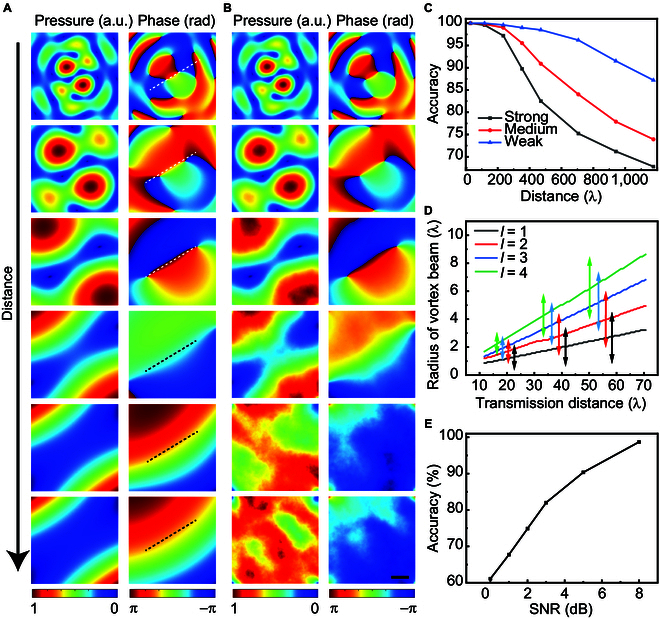
Effect of transmission distance, turbulence, and noise on FOAM decoding. (A) Cross-sectional maps of pressure and phase at different transmission distances of 29.41λ, 58.82λ, 117.64λ, 235.29λ, 588.24λ, and 1,176.47λ in the same field of view for l = ±1.4. (B) Corresponding cross-sectional maps of pressure and phase in the nonideal transmission condition with a weak turbulence of . As indicated by the dashed lines, the azimuthal angle of phase dislocation is independent of the transmission distance. (C) Distance dependence of the decoding accuracy with various turbulences (strong , medium , and weak ) for the 32-point dual-ring sampling. (D) Distance dependences of the optimized sampling radius for coupled FAVs with P-FOAMs of l = ±1 to ±4. (E) Decoding accuracy distribution with respect to the SNR of Gaussian noise. Scale bar, 2 cm.