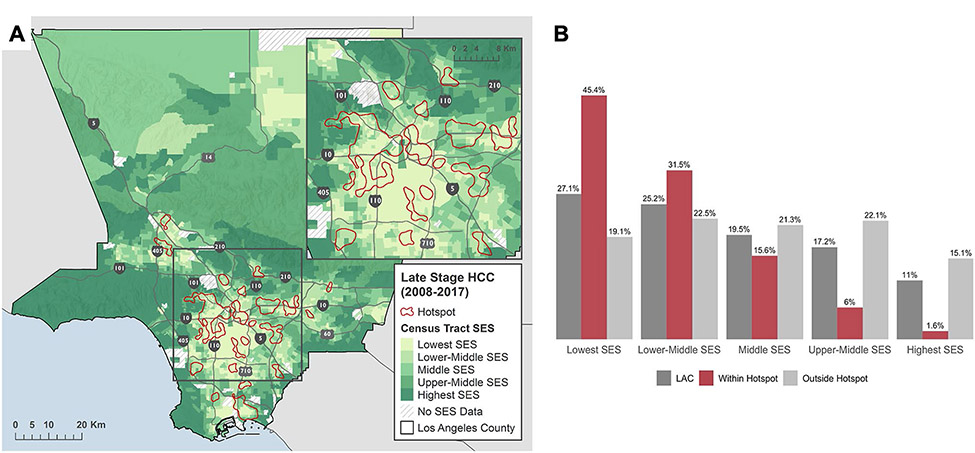
Fig. 2.
Relationship between socioeconomic status and hotspots by (A) mapping hotspots overlaid on census tract SES quintiles and (B) distribution of SES quintiles by hotspot status. SES socioeconomic, HCC hepatocellular carcinoma, LAC Los Angeles County. Each census tract in LAC was assigned a single SES quintile as represented in the left panel by a color scale: lightest green = lowest SES to darkest green = highest SES. Hotspot status for each census tract was assigned based on whether or not its centroid fell within a hotspot boundary

