
Figure 2.
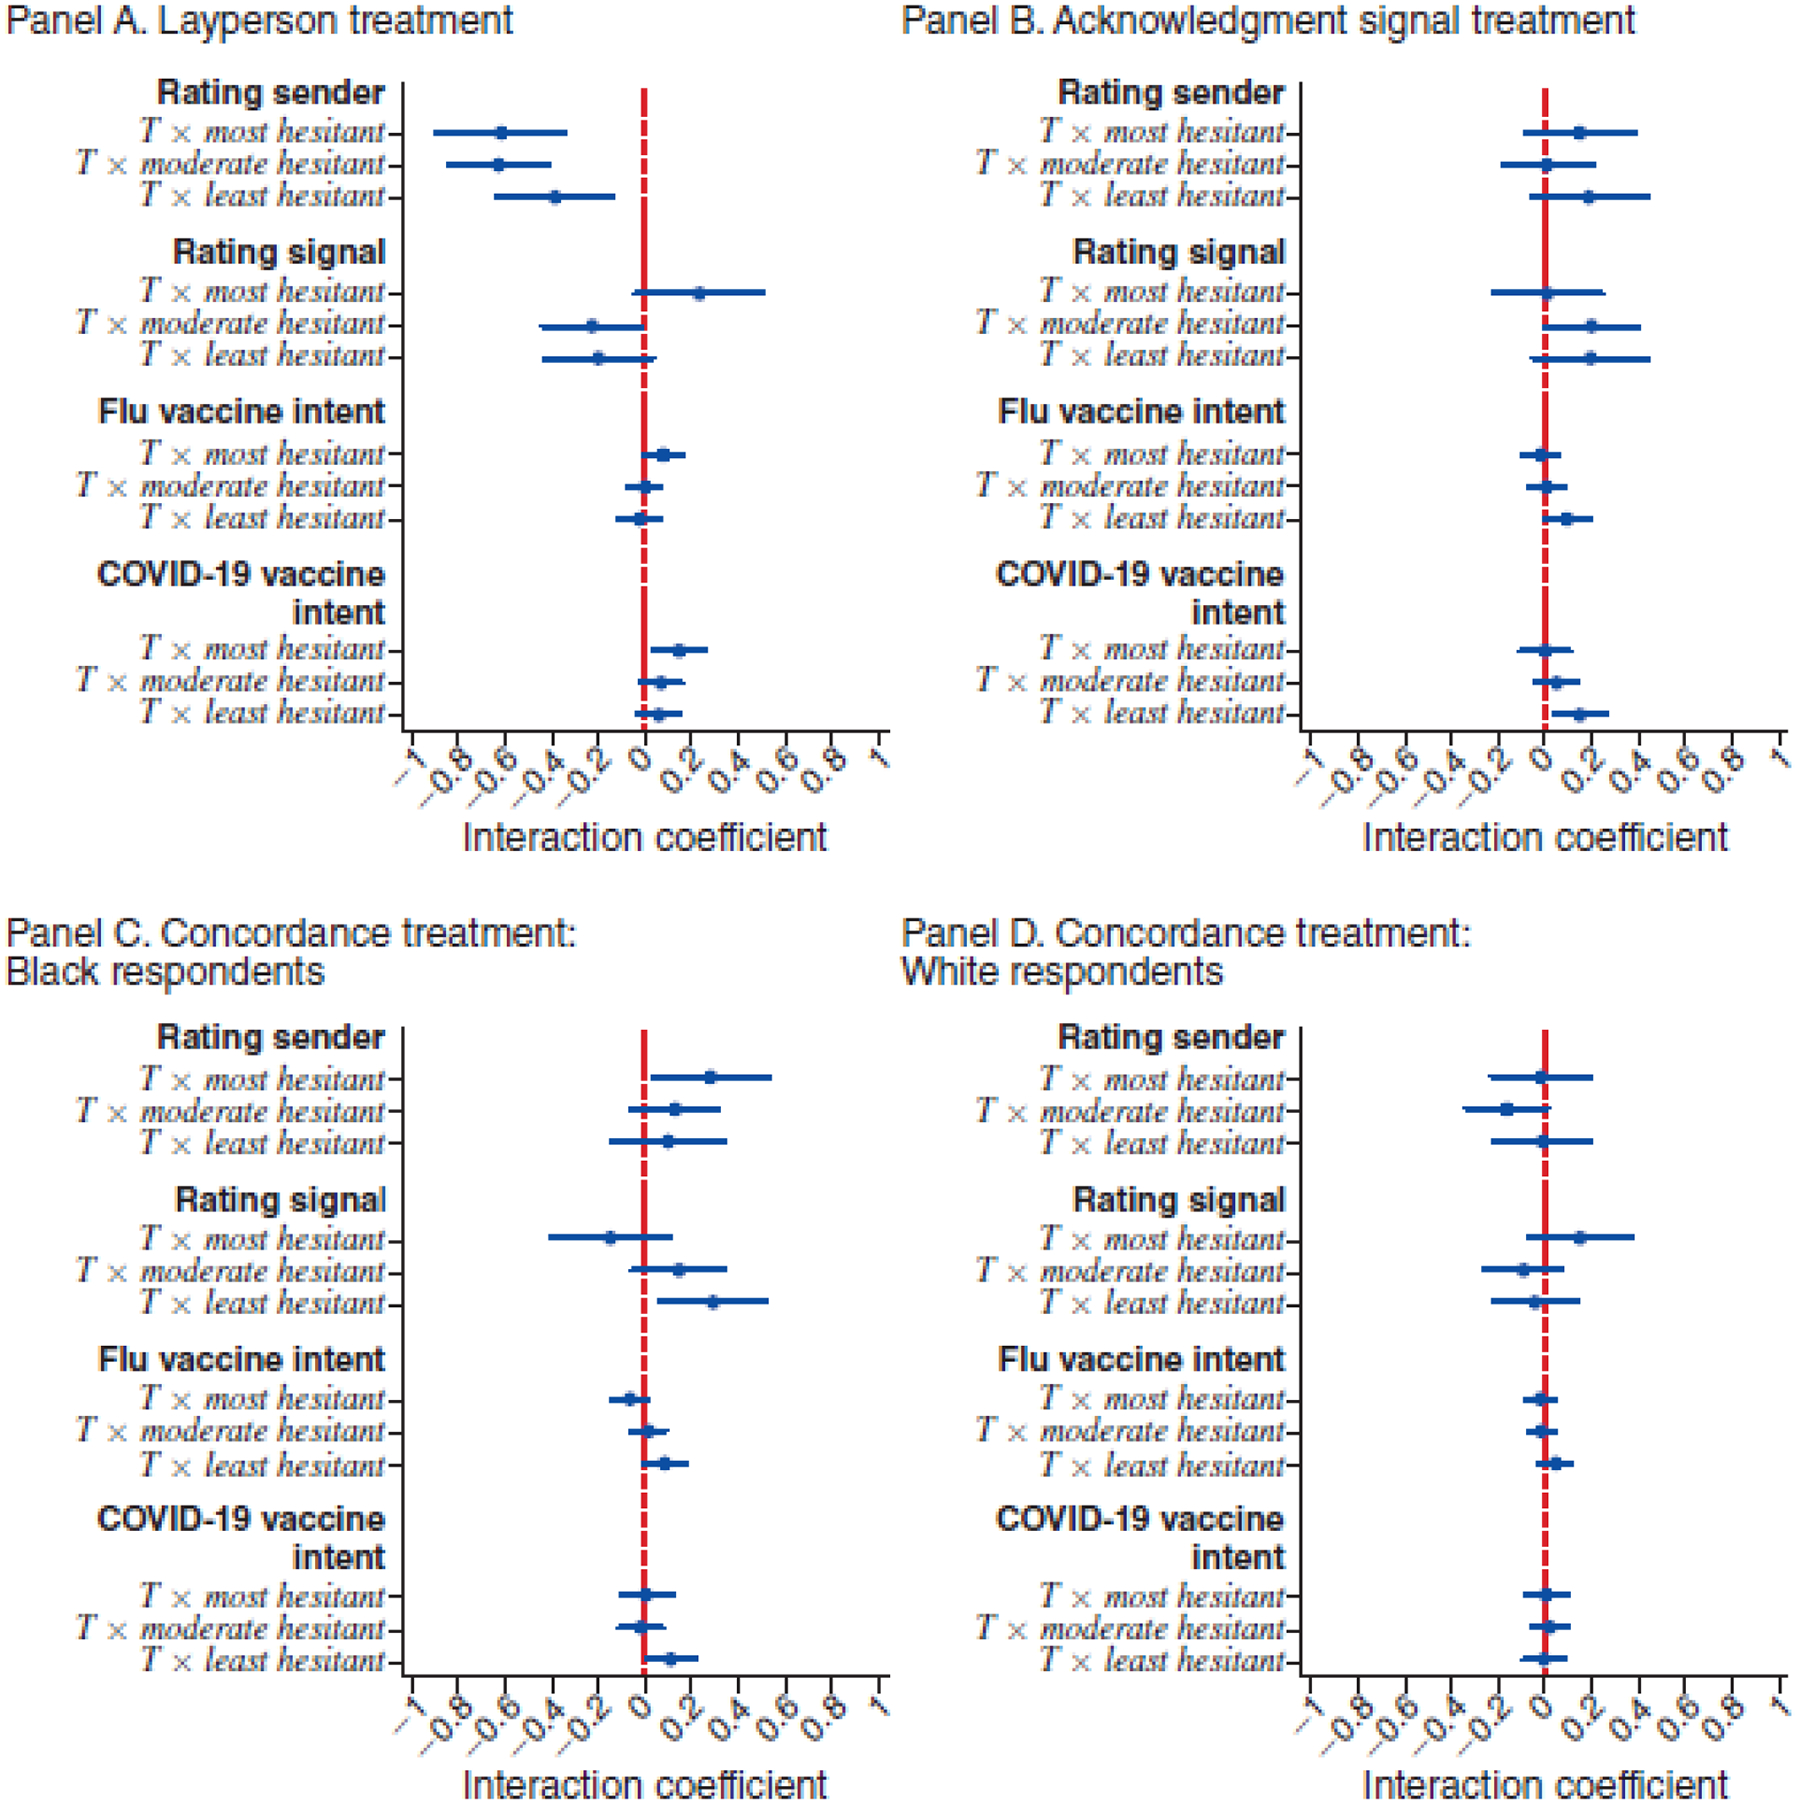
Heterogeneity by Vaccine Hesitancy
Notes: Based on OLS regression of each outcome (listed in bold face on the y-axis) of following form yi = α + β1Ti × Mosti + β2Ti × Moderatei + β3Ti × Leasti + γ1 Moderatei + γ2 Leasti + μXi + ϵi. Interaction coefficients are shown. Most hesitant is a binary variable equal to 1 if the respondent has never received the flu shot. Moderate hesitant is a binary variable equal to 1 if the respondent received the flu shot more than two years ago. Least hesitant is a binary variable equal to 1 if the respondent received the flu shot within the past two years, not including the current season. Controls Xi include season dummy and survey platform fixed effects. Sender rating and signal rating are inverse-covariance-weighted indices as described in Anderson (2008). Ninety-five percent confidence intervals using robust standard errors are shown.