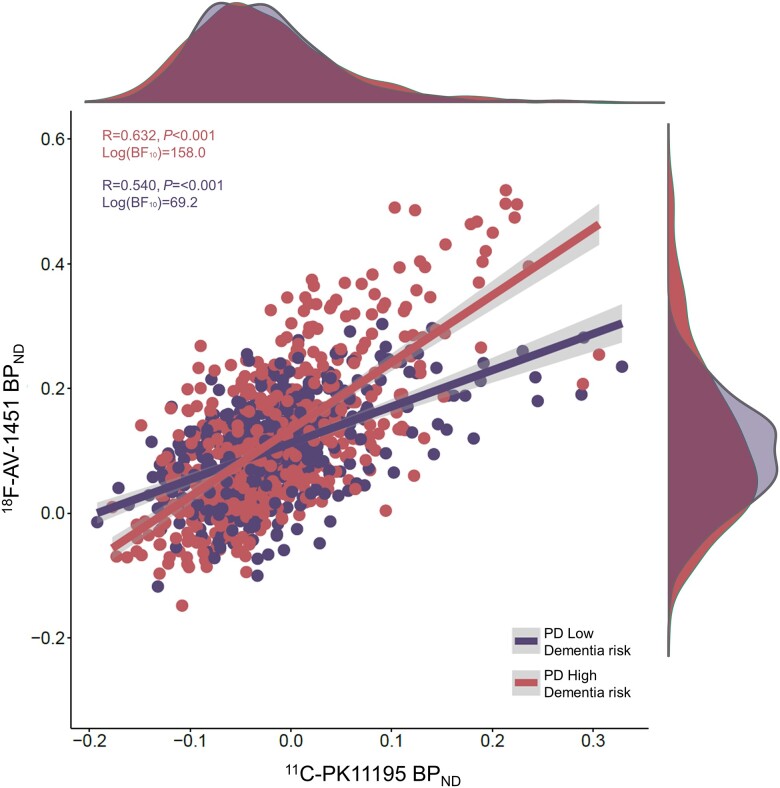
Figure 5.
Regional correlation between 11C-PK11195 BPND and 18F-Flortaucipir BPND. The dots represent individual regional values for each participant in the PD low dementia risk group and the PD high dementia risk group. 11C-PK11195 BPND showed a significant effect on 18F-Flortaucipir BPND at the whole cohort level in a linear mixed effects model, but only in the PD high dementia risk group was a significant correlation observed. BF10 = Bayes factor.

