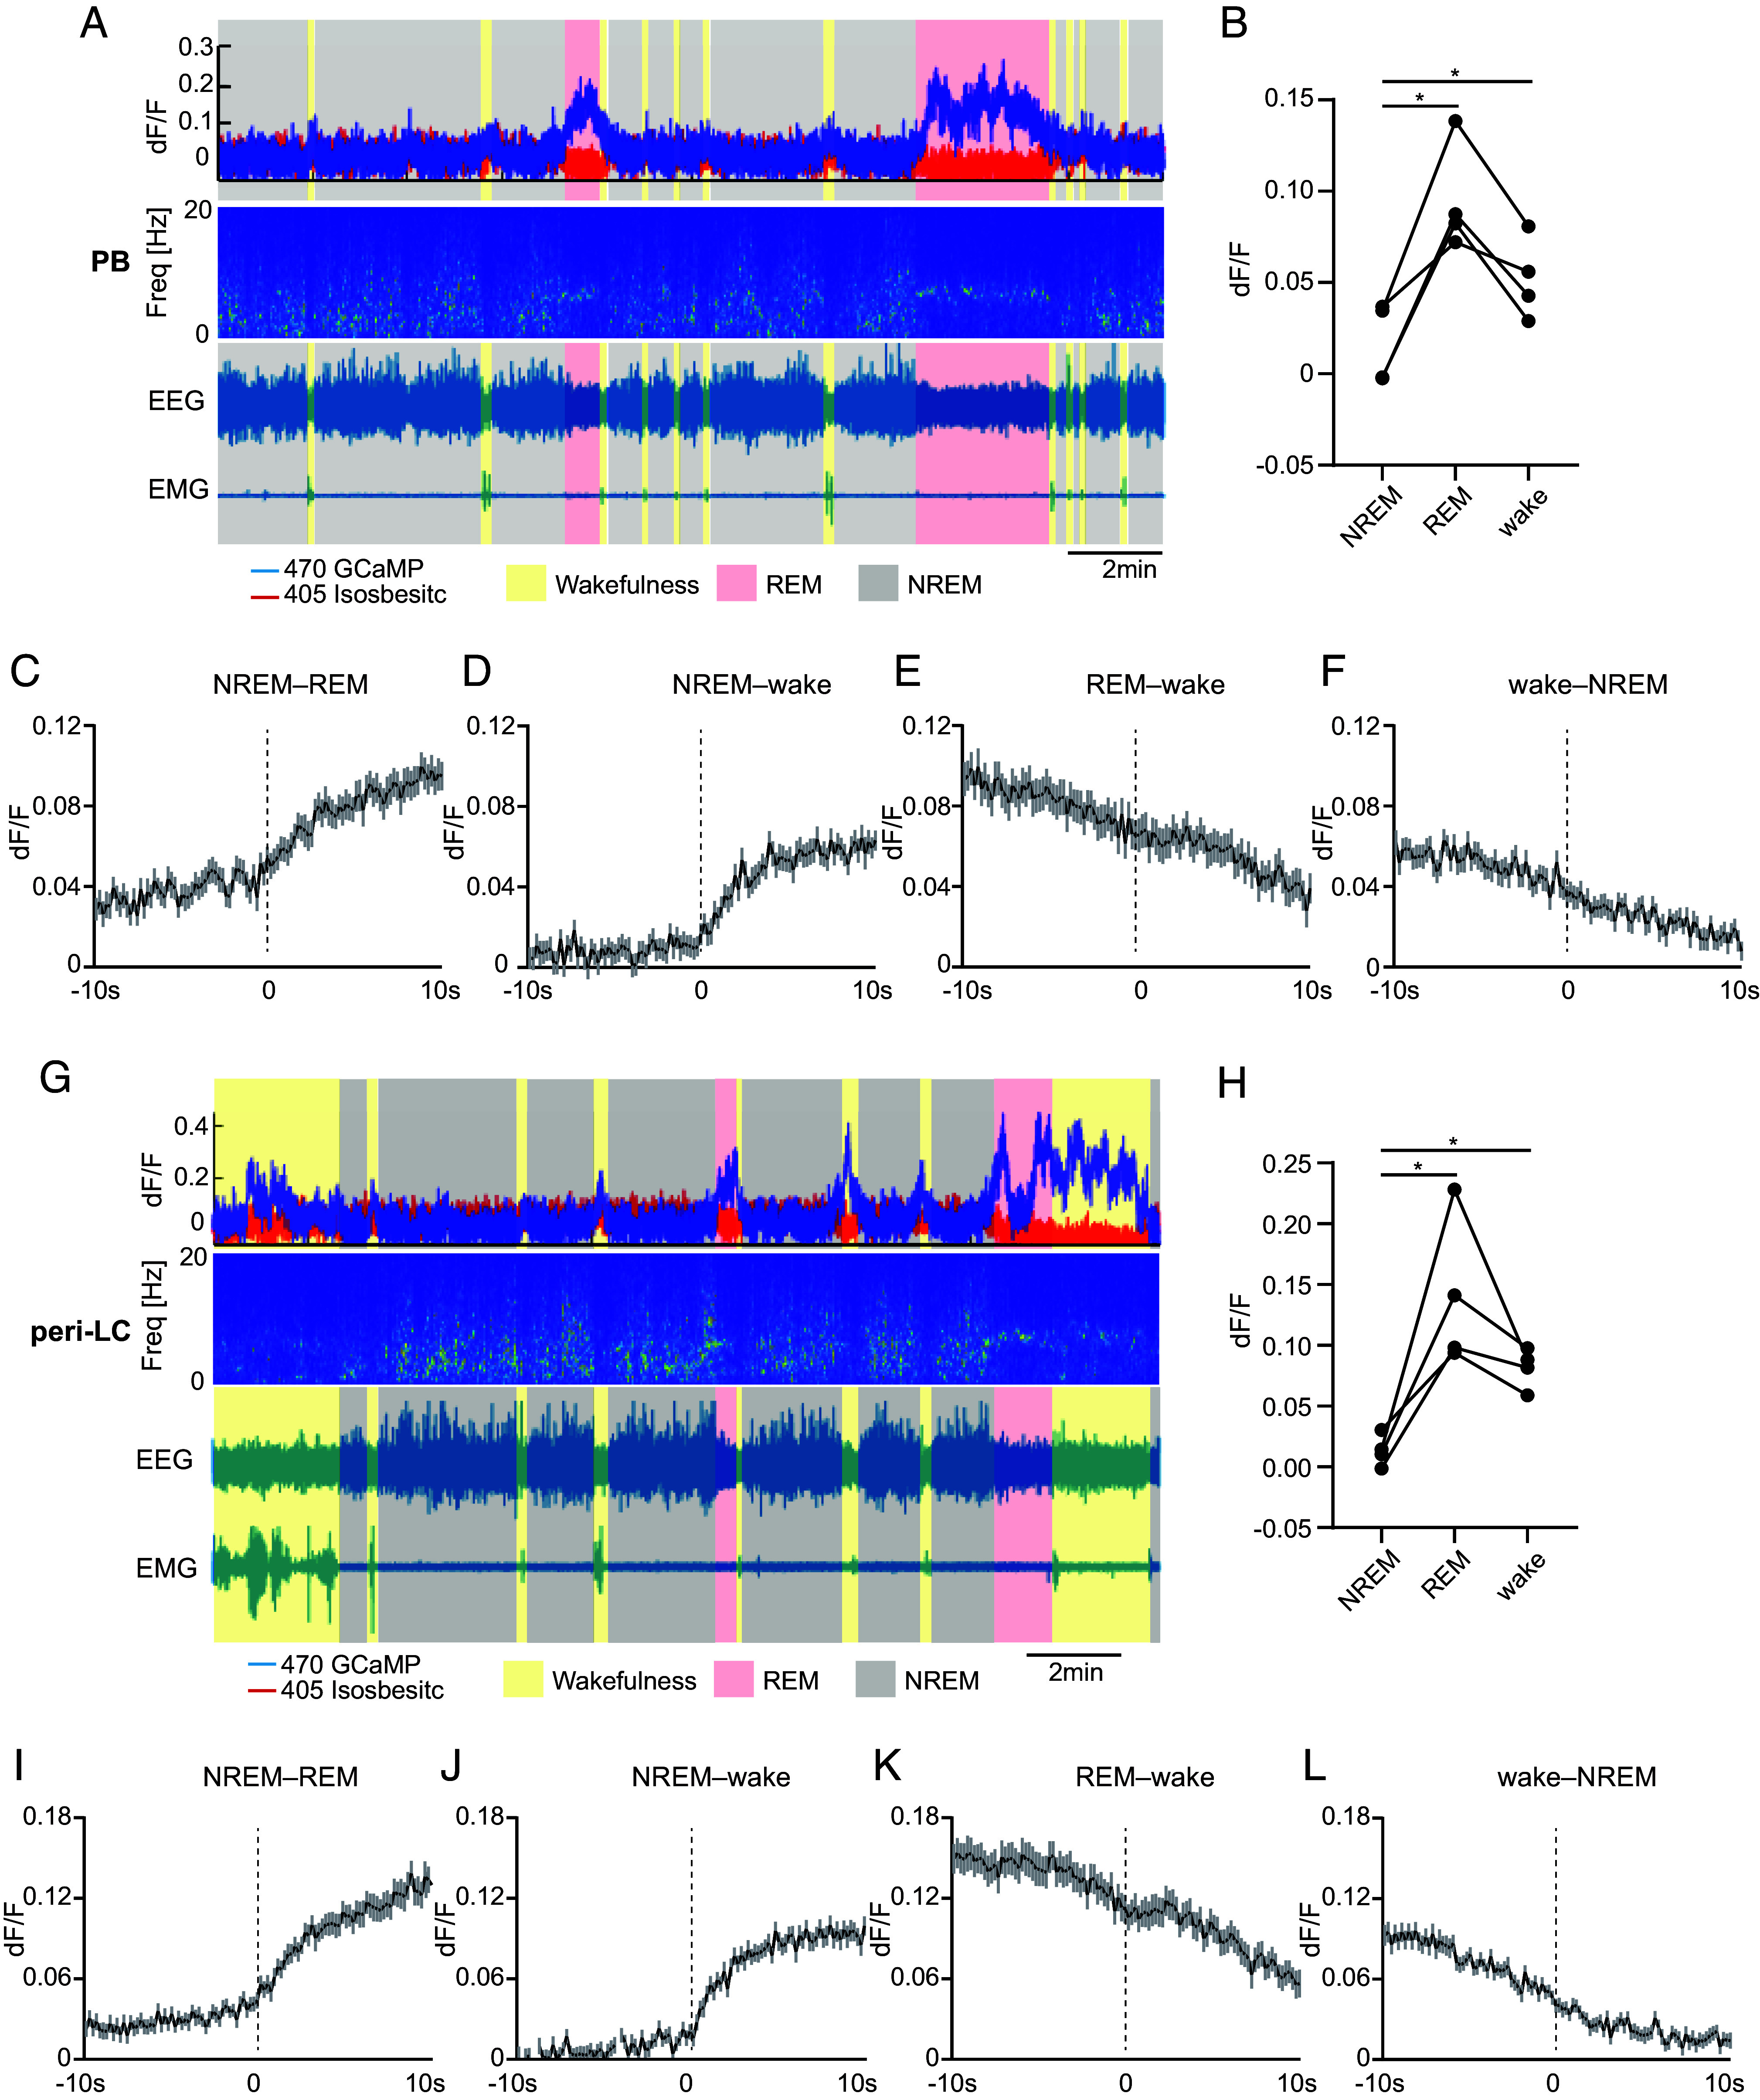
Fig. 3.

PB and peri-LC NPS+ neurons are wake- and REM-active. (A) Representative EEG power spectrogram, EEG, EMG, and fluorescence traces across spontaneous sleep-wake states of PB fiber photometry recording. (B) Quantified fluorescence signal across different sleep/wake states from n = 4 mice of PB recording. (C–F) Average fluorescence signals aligned to NREM–REM (C, 60 transitions), NREM–wake (D, 60 transitions), REM–wake (E, 60 transitions), and wake–NREM state transitions (F, 60 transitions) (n = 4 mice) for PB recording. (G) Representative EEG power spectrogram, EEG, EMG, and fluorescence traces across spontaneous sleep-wake states of peri-LC fiber photometry recording. (H) Quantified fluorescence signal across different sleep/wake states from n = 4 mice of peri-LC recording. (I–L) Average fluorescence signals aligned to NREM–REM (I, 60 transitions), NREM–wake (J, 60 transitions), REM–wake (K, 60 transitions), and wake–NREM state transitions (L, 60 transitions) (n = 4 mice) for peri-LC recording. *P < 0.05. RM one-way ANOVA, post hoc Dunnett's multiple comparisons test (B and H). Shaded areas represent ± SEM in (C–F and I–L).
