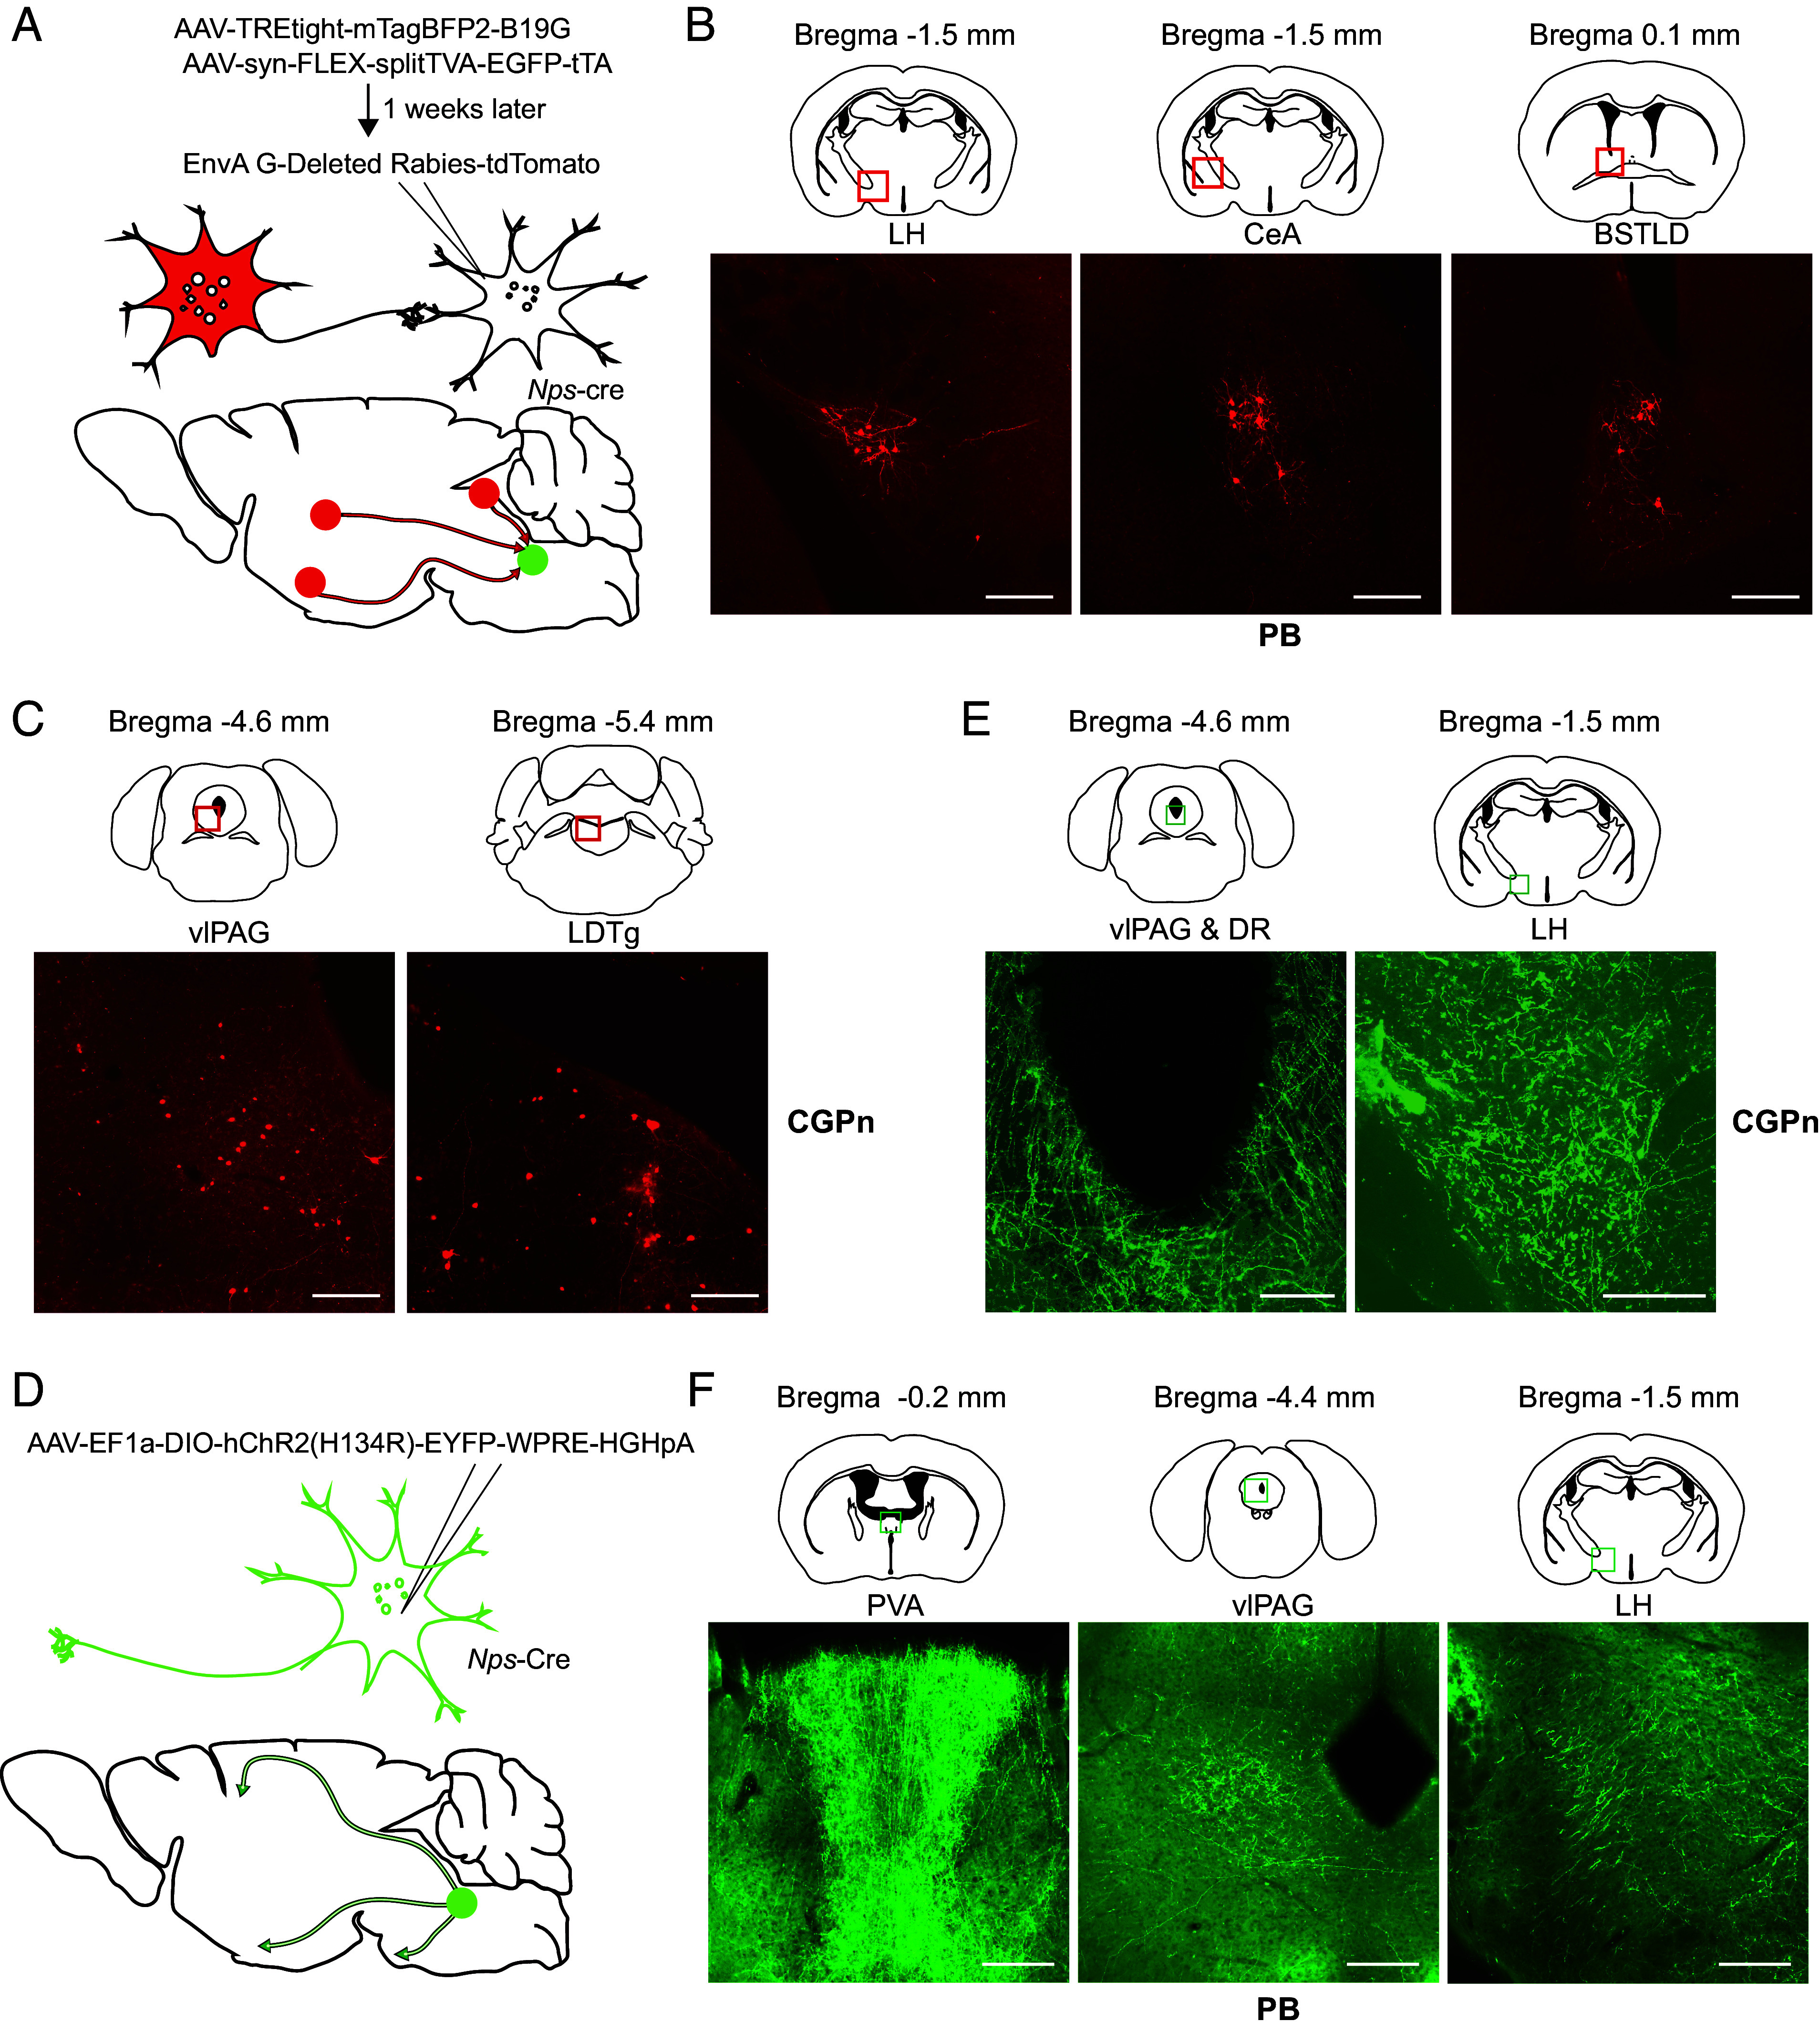
Fig. 6.

Retrograde and anterograde tracing of NPS+ cells. (A) Schematic strategy for identifying upstream neurons using RV-mediated retrograde tracing. (B) RV-labeled presynaptic neurons (red squares) of PB NPS+ cells. (C) RV-labeled presynaptic neurons (red squares) of CGPn NPS+ cells. (D) Schematic strategy for tracing projections of target neurons using virus [AAV5/EF1a-DIO-hChR2 (H134R)-EYFP]. (E) Expression of eYFP in PB NPS+ neuron terminals at indicated regions (green squares). (F) Expression of eYFP in CGPn NPS+ neuron terminals at indicated regions (green squares). Representative brain sections from n = 3 mice. (Scale bar, 200 μm.) BSTLD, laterodorsal bed nucleus of the stria terminalis; CeA, central amygdala; DMH, dorsomedial hypothalamus; DR, dorsal raphe; LDTg, laterodorsal tegmental nucleus; LH, lateral hypothalamus; PVA, anterior nucleus of paraventricular thalamus; PVT, paraventricular thalamic nucleus; vlPAG, ventrolateral periaqueductal gray.
