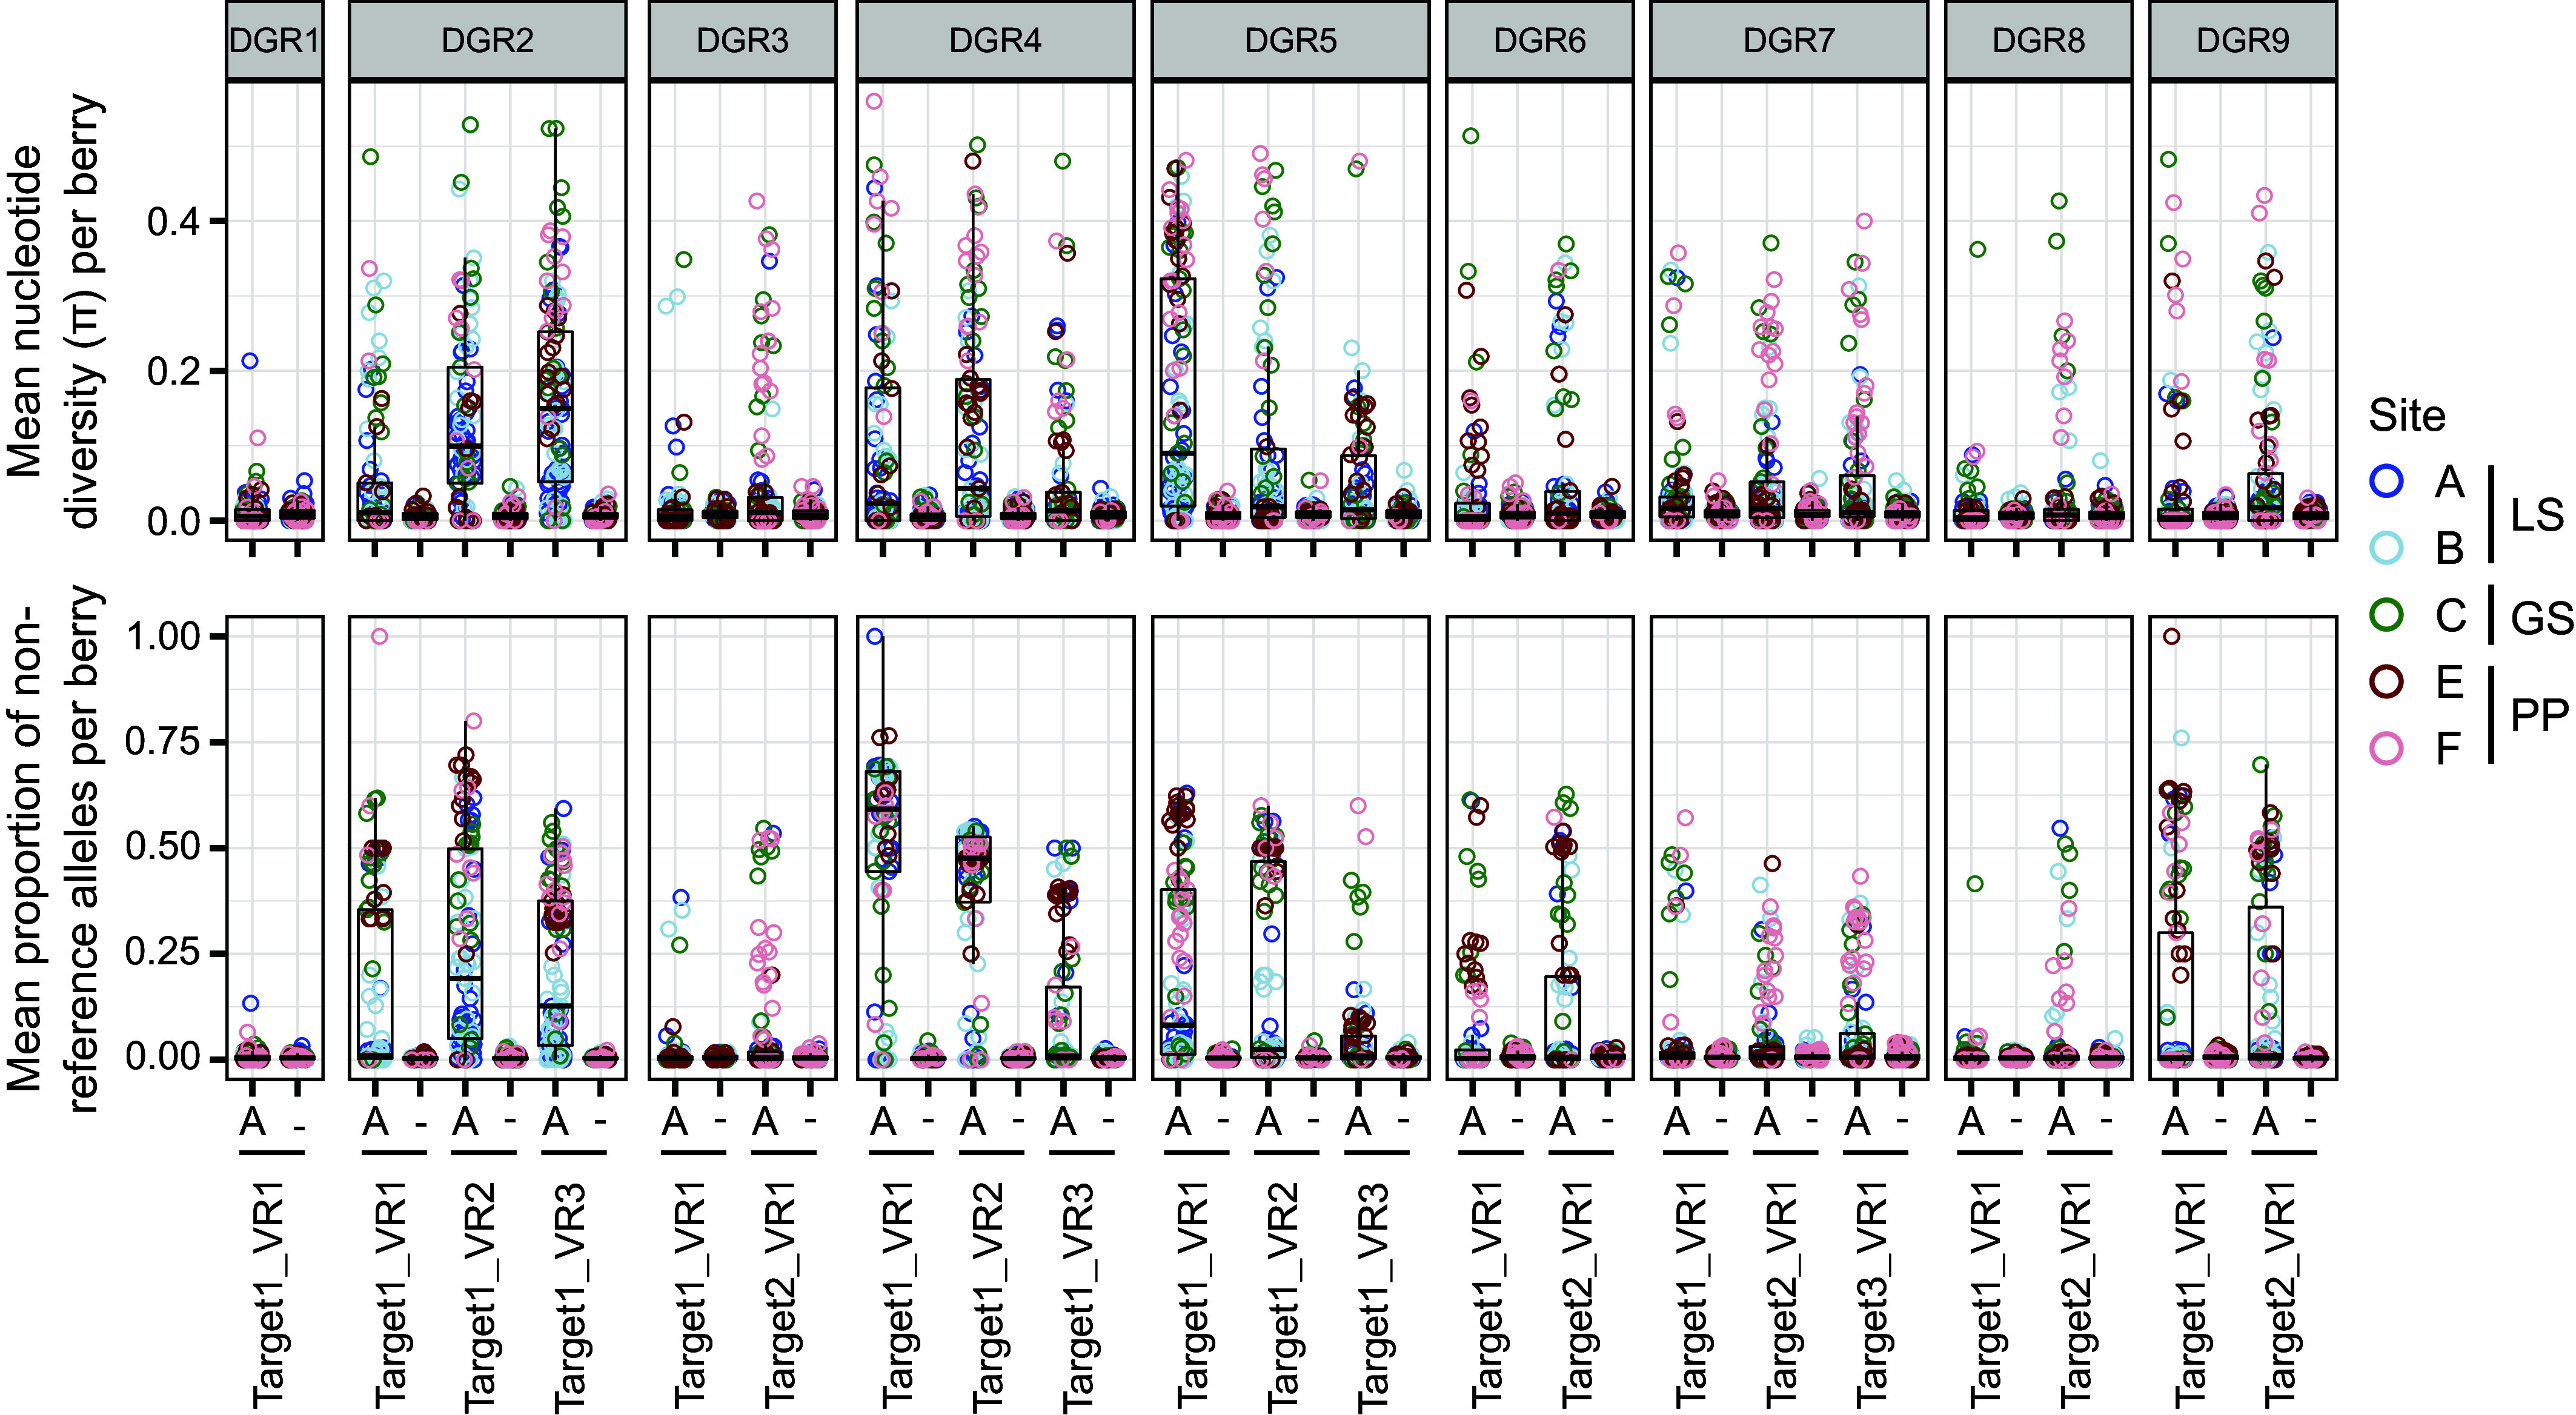
Fig. 6.

Metagenomics data reveals the differential diversification of PB-PSB1 DGR targets in 184 pink berry aggregates across their geographic range. For each DGR VR, the mean nucleotide diversity (Upper) and the mean proportion of non-reference alleles (Lower) within an aggregate were calculated separately for positions corresponding to an A in the TR (and thus targeted by mutagenesis, indicated by an A) and for all other positions (indicated by −). Each dot corresponds to a single aggregate colored by the sampling site, blue shades corresponding to Little Sippewissett (LS), green to Great Sippewissett (GS), and red shades to Penzance Point (PP). The boxplots summarize the distribution of values for all aggregates having enough coverage at a given VR.
