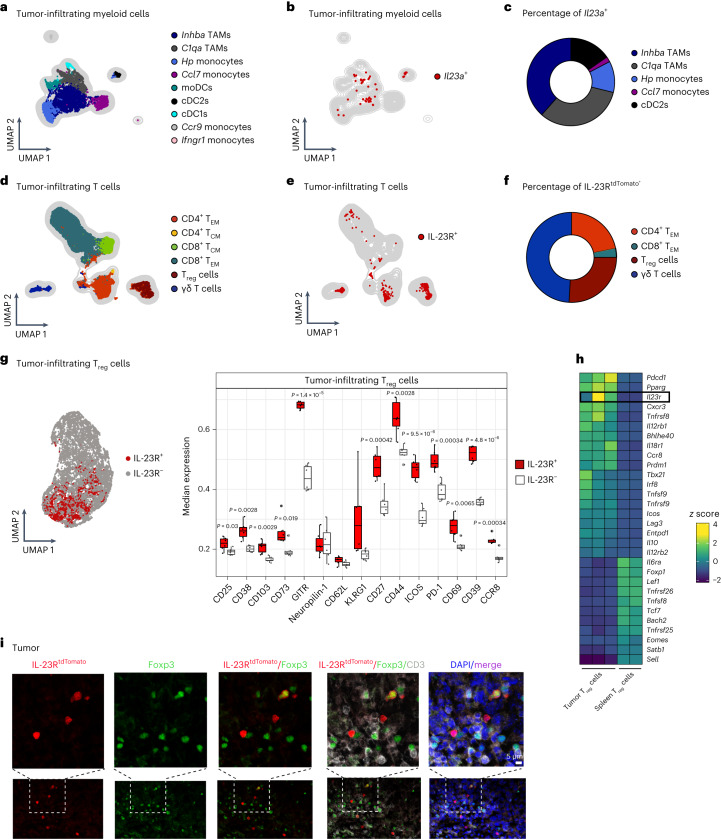
Fig. 1. IL-23R marks a highly suppressive Treg cell subset in the mouse TME.
a–c, Analysis of a myeloid cell scRNA-seq dataset from mouse B16 tumors18 (GSE188548; WT tumor). a, UMAP depicting tumor-infiltrating myeloid cell clusters. b, UMAP displaying Il23a+ myeloid cells. c, Pie chart displaying the frequencies of myeloid cell subsets among total Il23a+ myeloid cells. d–g, Foxp3DTR-GFPIL-23RtdTomato mice were inoculated intradermally (i.d.) with B16 tumors. TILs were analyzed by flow cytometry on day 14. Data are shown from one representative experiment out of two independent experiments with n = 5–6 biologically independent animals. d, UMAP with overlaid FlowSOM clustering (gated on CD45+TCRβ+TCRγδ+ cells). e, UMAP displaying IL-23RtdTomato+ T cells. f, Pie chart depicting the frequencies of T cell subsets among total IL-23RtdTomato+ T cells. g, UMAP with overlaid FlowSOM clustering displaying IL-23RtdTomato+Foxp3+ and IL-23RtdTomato–Foxp3+ Treg cell clusters (left). Box plots showing median expression of surface markers on IL-23R+ and IL-23R– Treg cells are shown on the right. Box plots display the median and interquartile range (IQR; 25–75%), with whiskers representing the upper and lower quartiles ± IQR. Statistical significance was calculated using two-tailed t-tests. h, Analysis of a bulk next-generation sequencing dataset of Treg cells sorted from B16 tumors or spleens (Magnuson et al.27). A heat map depicting selected genes among the top 50 DEGs is shown. Expression of Il23r is highlighted. i, Immunofluorescence stainings of tumors from i.d. inoculated B16 tumor-bearing IL-23RtdTomato mice showing Foxp3 (green), IL-23RTdtomato (red), CD3 (white), DAPI (blue) and merged signals (purple). Scale bar: 5 μm. Images shown (n = 4) are representative of two independent experiments; moDCs, monocyte-derived DCs; TCM, central memory T cells.

