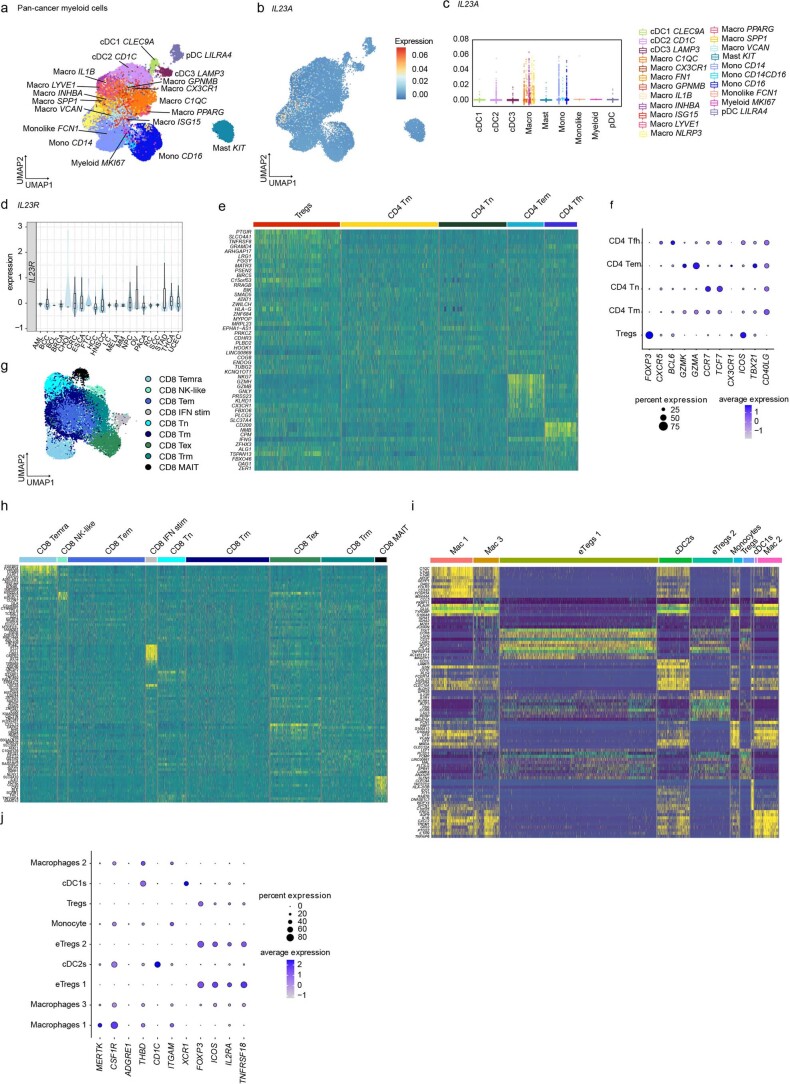
Extended Data Fig. 7. IL23R signaling induces an eTreg cell program in the human TME.
(a–c) Analyses of human myeloid pan-cancer single-cell sequencing data set from (Cheng et al. 2021) from n = 210 individual patients across 15 human cancer types. (a) UMAP displaying pan-cancer myeloid cells. (b) UMAP depicting pan-cancer myeloid cells with overlaid IL23A expression. (c) Box plot displaying average IL23A expression in different pan-cancer myeloid cell clusters (grouped by cell type). Boxplots display the median and interquartile range (IQR; 25-75%) with whiskers representing the upper and lower quartile +/- IQR. (d) Box plot displaying IL23R expression among Treg cells from patients with different cancer types. Boxplots display the median and interquartile range (IQR; 25-75%) with whiskers representing the upper and lower quartile +/- IQR. (e-i) Analyses of human pan-cancer single-cell sequencing data set from Zheng et al.41 (e, f, g, h) and analyses of scRNAseq dataset of human colorectal carcinomas (Liu et al.43) (i, j). (g) UMAP depicting pan-cancer CD8+ T cells. (e, h, i) Heatmap depicting the expression of cell-type defining genes. (f, j) Dotplots showing the expression of selected cell lineage markers.

