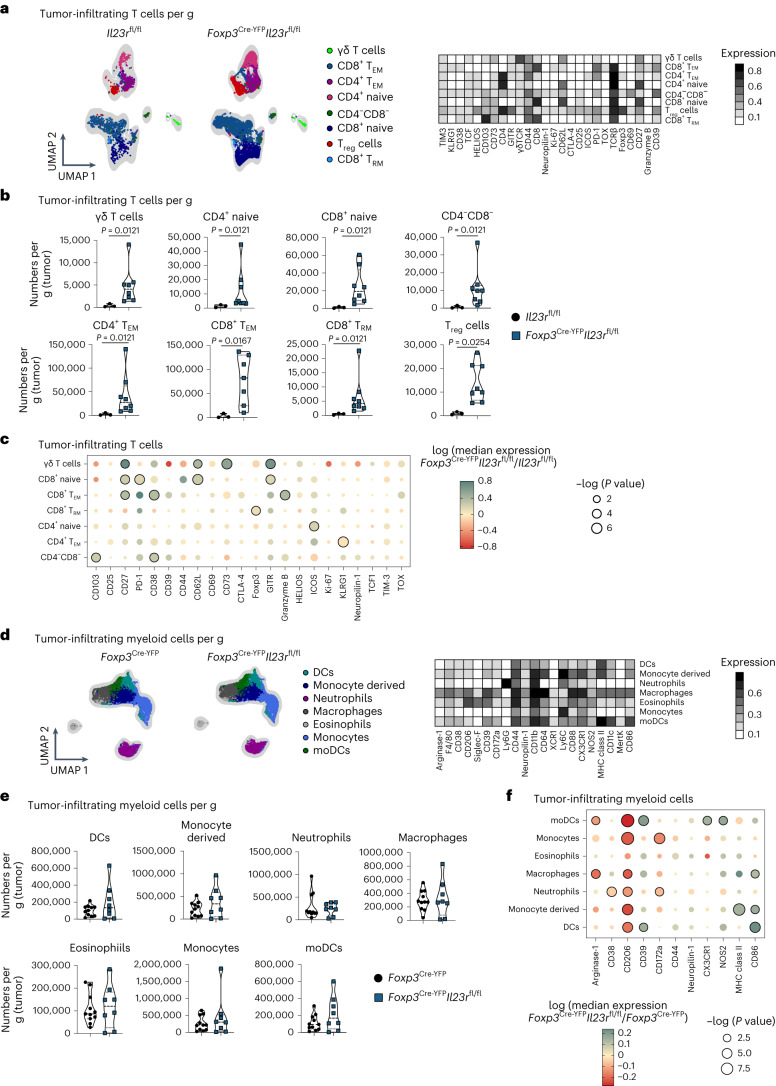
Fig. 3. IL-23R signaling in Treg cells suppresses antitumor immunity.
a–f, Il23rfl/fl and Foxp3Cre-YFPIl23rfl/fl mice (a–c) or Foxp3Cre-YFP and Foxp3Cre-YFPIl23rfl/fl mice (d–f) were inoculated i.d. with B16 tumor cells, and TILs (gated on CD45+TCRβ+TCRγδ+ cells; a–c) or myeloid cells (gated on CD45+CD90.2–CD19–NK1.1– cells; d–f) were analyzed by flow cytometry on day 14 after inoculation. Data are shown from one representative experiment out of two independent experiments with n = 3–7. a,d, UMAP with overlaid FlowSOM clustering (left) and heat map depicting relative marker expression among identified cell clusters (right). b,e, Violin plots depicting cell numbers of identified cell clusters per gram (tumor). Data are displayed as mean ± s.e.m. Statistical significance was determined using a two-tailed Mann–Whitney U-test. c,f, Dot plot displaying median marker expression in identified cell clusters comparing Foxp3Cre-YFPIl23rfl/fl and Il23rfl/fl (control group) mice (c) or Foxp3Cre-YFPIl23rfl/fl and Foxp3Cre-YFP (control group) mice (f). Statistical significance was determined using two-tailed t-tests. Color represents log (median expression Foxp3Cre-YFPIl23rfl/fl/median expression control group); that is, red indicates that median expression is decreased in Foxp3Cre-YFPIl23rfl/fl mice compared to in the control group, and green indicates that median expression is increased in Foxp3Cre-YFPIl23rfl/fl mice compared to in the control group. Circle size represents log (P value). Statistically significant changes (P < 0.05) are highlighted with black lines around the circles; TRM, resident memory T cells.

