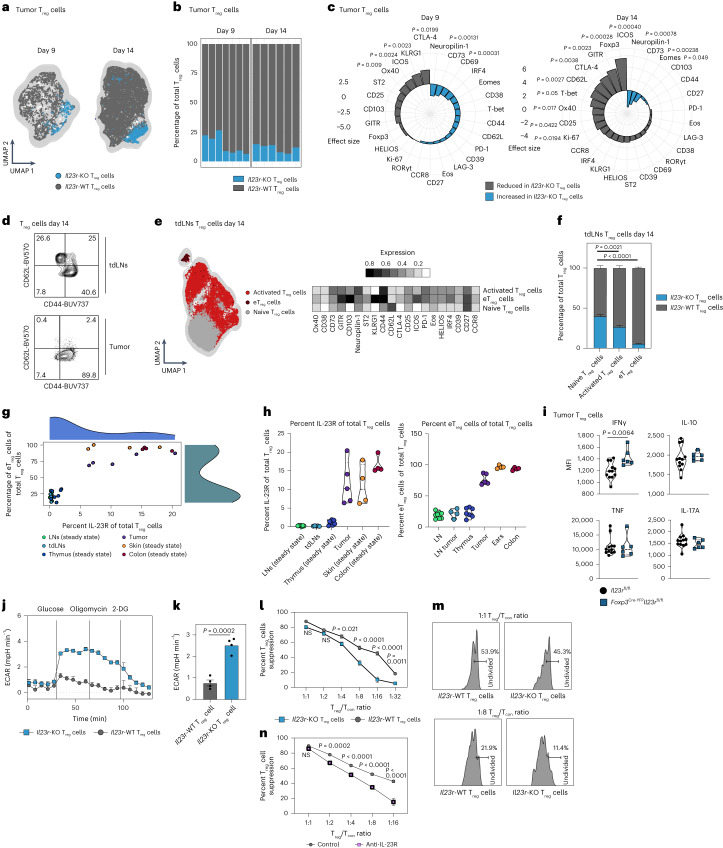
Fig. 4. IL-23R signaling confers a selective advantage on eTreg cells.
a–f, Foxp3Cre-YFP/+Il23rfl/fl female mice were inoculated i.d. with B16 cells and Treg cells from tumors, and tdLNs were analyzed by flow cytometry on day 9 or 14 after injection. Data are shown from one representative experiment out of two independent experiments with n = 5–6. a, UMAP and FlowSOM clustering displaying Treg cell subsets in tumors. b, Frequency plots of Il23r-KO and WT Treg cells out of total Treg cells in tumors. c, Spiral plot displaying the effect size of differential marker expression between Il23r-KO and WT Treg cells in tumors. d, Representative contour plots depicting Treg cells on day 14 after tumor inoculation. e, UMAP and FlowSOM clustering displaying Treg cells in tdLNs on day 14 after tumor inoculation (left). A heat map depicting relative marker expression is shown on the right. f, Frequency plots of subsets of Il23r-KO and WT Treg cells in tdLNs on day 14 after tumor injection. Statistical significance was determined by two-way ANOVA with a Sidak’s post hoc test. g,h, Scatter plot (g) and violin plots (h) displaying frequencies of IL-23R+ Treg and eTreg cells among total Treg cells. Data are pooled from one to two experiments with n = 3–5. i, Il23rfl/fl and Foxp3Cre-YFPIl23rfl/fl mice were inoculated i.d. with MC38 tumor cells. Treg cells were analyzed by flow cytometry on day 14 after inoculation. Violin plots display the median expression (median fluorescence intensity (MFI)) of cytokines. The data shown are from one experiment with n = 6–12. j, Extracellular acidification rate (ECAR) measurement of Treg cells from spleens and LNs of Foxp3Cre-YFPIl23rfl/fl or Foxp3Cre-YFPmice under the specified conditions after stimulation with anti-CD3/anti-CD28, IL-2 and IL-23 for 72 h. Data are representative of the results of two independent experiments with n = 4. k, Quantification of glycolysis in Il23r-KO and WT Treg cells. l–n, Ex vivo suppression of CellTrace Violet-labeled CD4+ conventional T (Tcon) cell proliferation by Il23r-KO and WT Treg cells (l and m) or WT Treg cells ± anti-IL-23R (n). Data shown are from two independent experiments with n = 5. Statistical significance was assessed by two-way ANOVA with a Sidak’s post hoc test. Data in f, i, k, l and n are displayed as mean ± s.e.m. Statistical significance in c and i–k was determined using two-tailed t-tests; 2-DG, 2-deoxyglucose; NS, not significant.

