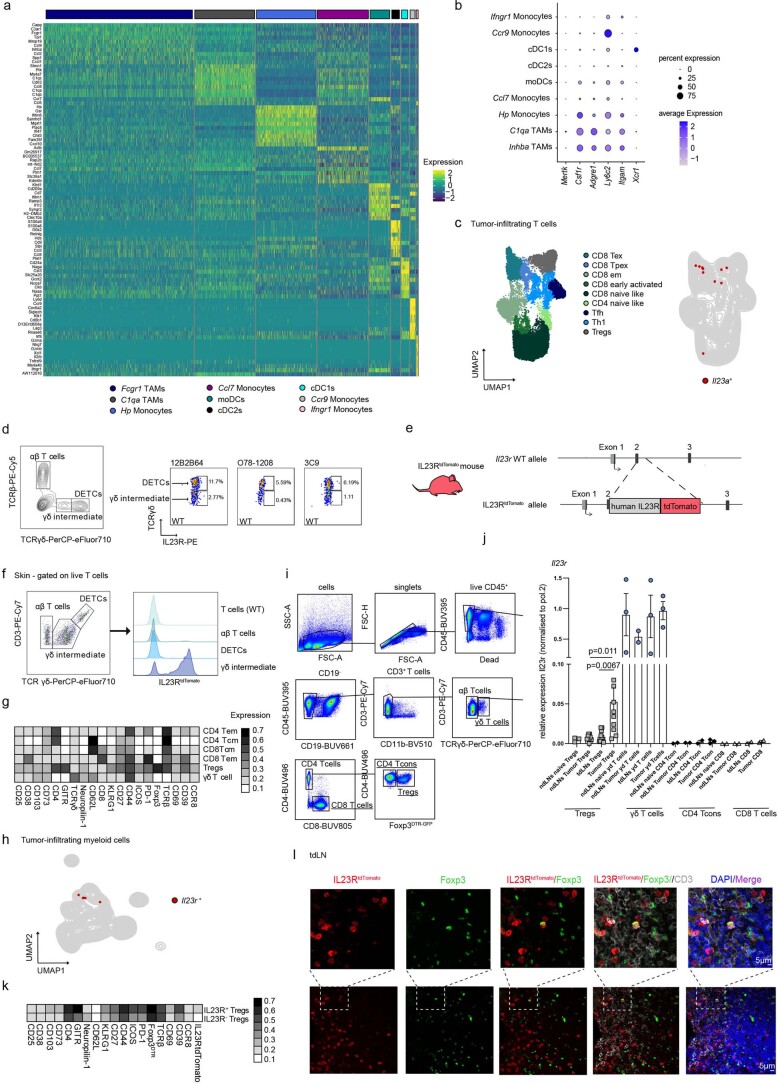
Extended Data Fig. 1. IL23R marks a highly suppressive Treg cell subset in the murine TME.
(a, b, h) Myeloid cell-scRNAseq data from murine B16 tumors (Mujal et al. 2022, GSE188548). (a) Heatmap depicting the expression of cell-type-defining genes. (b) Dotplot showing the expression of selected linage markers. (c) scRNAseq data of murine pan-tumor T cells (Andreatta et al. 2022, E-MTAB-9274). UMAP displaying T cell subsets (left) or Il23a+ T cells (right). (d) Representative FACS plot (left) of steady state murine skin CD45+cells (left) (pregated on live, CD45+cells). Representative FACS plots (right, pregated on live, CD45+, TCRγδ+) with gates of positive signal of respective IL23R-PE antibody clones of dendritic epidermal T cells (DETCs) (upper gate) and γδintermediate T cells (lower gate). Displayed data are from one experiment with n = 4. (e) Schematic illustration of the IL23RtdTomatoallele. (f) Representative FACS plot (left) of murine skin T cells and histograms (right) depicting IL23RtdTomato expression among T cell subsets from IL23RtdTomato mice and total T cells (‘T cells’) from WT mice. Data shown from one representative experiment out of two independent experiments with n = 3. (g, k) T cells from i.d. inoculated B16 tumors in Foxp3DTR-GFP IL23RtdTomato mice were analyzed by flow cytometry on day 14. Data shown from one representative experiment out of two independent experiments with n = 5-6. (g) Heatmap displaying marker expression among tumor-infiltrating T cell subsets. (h) UMAP displaying Il23r+ myeloid cells. (i) Gating strategy used to FACS-sort γδ, CD8+, CD4+ T cells and Foxp3+ Treg cells from Foxp3DTR-GFP mice. (j) Bar graph depicting relative Il23r mRNA expression level (qPCR) in FACS sorted T cells from steady state LNs or tdLNs, ndLNs and tumors from i.d. inoculated B16 tumor-bearing Foxp3DTR-GFP mice. Pooled data from three independent experiments. Biologically independent samples: n = 2: ndLNs: γδ T cells, naïve CD4 Tcon; ndLNs: naïve CD8; tdLNs: CD8, CD4 Tcon; Tumor: CD8. n = 3: ndLNs: naïve Treg cell, naïve γδ T cells, γδ T cells; Tumor: γδ T cells, CD4 Tcon. n = 8: ndLNs Tumor Treg cell. n = 10: tdLNs: Treg cell; Tumor: Treg cell. Data are displayed as mean +/- SEM. (k) Heatmap displaying relative marker expression among IL23R+ and IL23R−Treg cellclusters. (l) Immunofluorescence-stainings of tdLNs from i.d. inoculated B16-tumor bearing IL23RtdTomato mice. Foxp3 (green), IL23RtdTomato (red), CD3 (white) DAPI (blue), merged (purple). Images (n = 4) are representatives from 2 independent experiments.

